
Christine Wang, CFA, CPA

Andrew L. Berkin, PhD

Geoff Crumrine
Highlights
- Small-cap value stocks have lagged the large-cap S&P 500 by significant amounts to start 2023.
- This dispersion of returns has led to small-cap value stocks being extremely cheap compared to the S&P 500.
- Combined with the narrowness of returns within the S&P 500, such conditions have historically provided an opportunity for strong reversion, with small-cap value stocks outperforming.
Waiting for the World to Change
As small-cap value investors, sometimes it feels like you are just Waiting on the World to Change. The Russell 2000 Value Index lagged the S&P 500 Index of large US companies by a significant margin four years in a row from 2017 through 2020. The Russell 2000 Value staged a comeback in early 2021 (see our piece Room to Run), offering glimpses that we had turned a corner, but 2023 has reverted to the same chorus. It sometimes feels like we’re stuck with a broken record.
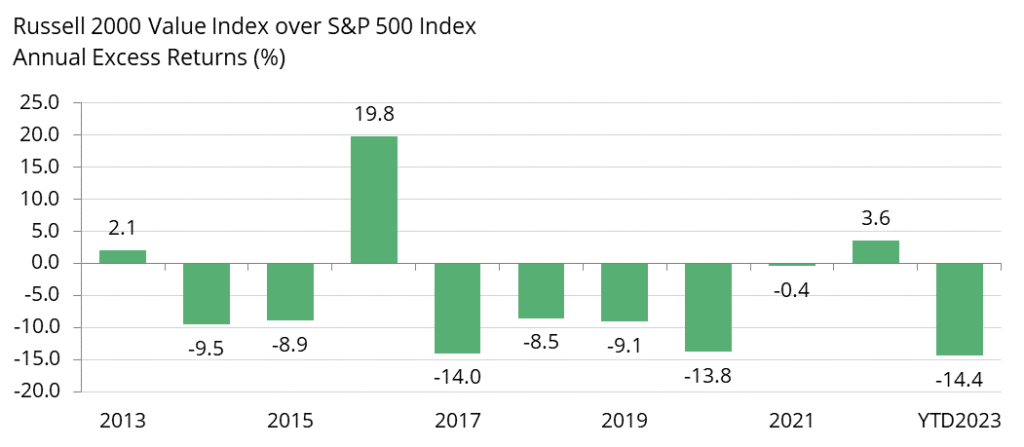
Source: Bloomberg
We at Bridgeway are firm believers in the small and value factors. These drivers of returns are integral parts of our investment process. Using the full history currently available from the Ken French data library (July 1926 – May 2023), we find small-cap value stocks have returned 14.1% annually, compared to 10.0% for the broad market. Not only do these factors historically provide a return premium, but they also meet our criteria of being persistent, pervasive, robust, investable, and intuitive. Furthermore, they provide useful diversification to the overall portfolio. (See the book Your Complete Guide to Factor-Based Investing by Andrew Berkin and Larry Swedroe for further discussion.)
Given small-cap value’s recent performance, where do we stand right now?
Using the standard academic definition of valuation, book-to-market (BtM), we can put into perspective where we are relative to history. The blue line in the chart below shows the ratio of median BtM for the Russell 2000 Value Index to median BtM for the S&P 500. The solid orange line shows the median ratio for the entire history of the Russell 2000 Value from 1978- June 2023. Ratios above this line signal that small-cap value stocks are cheaper than their historical average.
Median BtM Ratios Relative to S&P500
For the Period Ending 6/30/23
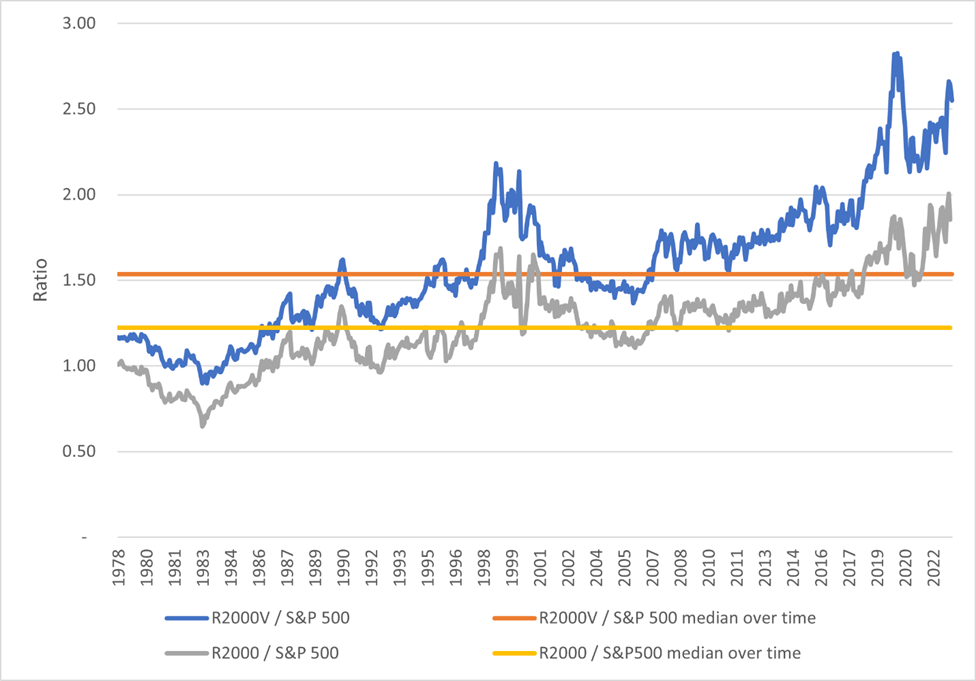
Source: Compustat, Bridgeway calculations
The first big spike when the Russell 2000 Value was cheaper than the S&P 500 was the dot.com era. Investors did Party Like It’s 1999, favoring high-flying growth stocks over value stocks. Valuations then reverted to the median (yielding five years of double-digit outperformance of the Russell 2000 Value vs. the S&P 500). The 2010s saw valuations creep back up, culminating in a new peak in 2020 of how cheap small-cap value had gotten relative to the S&P500. That reversed dramatically (and quickly) in 2021, bringing relative valuations down but still higher than historical levels. The relative underperformance of small-cap value in 2023 has stretched the ratio again, getting us close to, but not yet at the prior peak. This potentially sets the stage for a future reversal with strong small-cap value outperformance.
In the recent period, small-cap stocks, represented by the Russell 2000, have faced a similar relationship to the S&P 500 (grey line) as the Russell 2000 Value, becoming far cheaper than their median (yellow line). Small caps in general are now even cheaper than the historical median Russell 2000 Value to S&P 500 ratio.
So why stick to small-caps and value in particular? For one, the rally in the S&P 500 has been concentrated in a few stocks. While this is not new (see our piece on the Nifty Fifty), it does mean the rally has lacked breadth. The equal weight S&P 500 lagged the index by almost 10% to begin 2023. That’s in the worst 2% of six-month periods going back to 1990 when Bloomberg data starts. Small-cap value is incredibly cheap right now and while things could get worse before they get better, we encourage you to Don’t Stop Believin’. Stick with your allocation and rebalance. That would be music to our ears.
For a PDF download of this thought piece, please use the following link:
Waiting on the World to Change – Small-Cap Value Investors
DISCLOSURE
The opinions expressed here are exclusively those of Bridgeway Capital Management (“Bridgeway”). Information provided herein is educational in nature and for informational purposes only and should not be considered investment, legal, or tax advice.
Past performance is not indicative of future results.
Investing involves risk, including possible loss of principal. In addition, market turbulence and reduced liquidity in the markets may negatively affect many issuers, which could adversely affect client accounts. Value stocks as a group may be out of favor at times and underperform the overall equity market for long periods while the market concentrates on other types of stocks, such as “growth” stocks.
Diversification neither assures a profit nor guarantees against loss in a declining market.
The S&P 500 Index is a broad-based, unmanaged measurement of changes in stock market conditions based on the average of 500 widely held common stocks.
The Russell 2000 Index is an unmanaged, market value-weighted index, which measures the performance of the 2,000 companies that are between the 1,000th and 3,000th largest in the market. The Russell 2000 Value Index measures the performance of those Russell 2000 companies with lower price-to-book ratios and lower forecasted growth values.
One cannot invest directly in an index. Index returns do not reflect fees, expenses, or trading costs associated with an actively managed portfolio.