
John Montgomery

Christine Wang, CFA, CPA
Summary
As a firm that practices relational investing, we stay curious about what we see in the market, how that translates to our investment strategies and are committed to stating where we stand. The first quarter landscape for US small-cap value stocks presents a wonderful case study to share.
After a dramatic four-plus years of underperformance, small-cap value stocks came roaring back over the last year through March 31, 2021. Is this “run” of small-value stocks over, or is there more to go? Bridgeway’s analysis indicates that the size factor (less so the value factor) has indeed made up tremendous ground over the last year. However, based on our analysis of relative book-to-market valuations through the end of March, prices of small-value stocks would have to rise another 43% relative to the broader US market to get back to median historical levels.[1] At Bridgeway, we don’t believe in timing the market, but we do believe in establishing and holding appropriate factor exposures as a long-term investing best practice. After the tremendous run of large and growth stocks over the last decade, we believe small-value stocks still have room to run, and investors whose portfolios have become underweight to this segment of the market should add to their allocation.
What a Difference a Year Makes
Anyone investing in small-value stocks over the last handful of years has felt the full brunt of two factors dramatically out of favor at the same time. The Russell 2000 Value Index lagged the S&P 500 Index of large US companies by roughly double digits four years in a row from 2017 through 2020. In 2020 alone, large-cap stocks trounced small-cap value stocks by more than 33%.[2] FANMAG stocks were all the rage[3]. In this environment, not surprisingly, we have seen articles calling out the death of value and examining the question of whether size ever really was a factor.[4] Our favorite title was “Waiting for Godot.”[5]
But what a difference a year makes. First, let’s look at size. Table One below shows the performance of stocks as measured by deciles of size in the Center for Research in Securities Prices (CRSP) database as of March 31, 2020. The smallest companies (“CRSP 10”) lagged the largest companies (“CRSP 1”) in every category except the twenty-year and since-1926 periods.
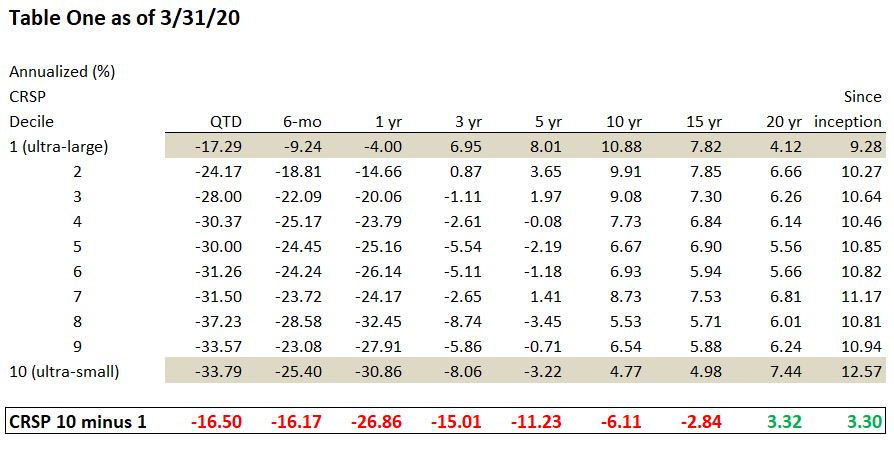
Source: CRSP
Table Two shows the same chart, but a year later. Including a very strong first quarter to start 2021, the small size factor has come roaring back. During this period, many of the top-performing funds and ETFs (Exchange Traded Funds) had “small-cap” in the name. No wonder why: looking at the full spectrum of companies by size in the Center for Research in Securities Prices database, we find the smallest companies (“CRSP 10”) made up tremendous ground. For example, at the end of Q1 2020, the smallest decile of stocks lagged the largest by over –15% annually for the past three years. Yet just one year later, those smallest stocks have now outperformed their larger peers by over 3% annually for the trailing three years. With this dramatic recovery of size, it’s fair to ask, “Is there any room to run?”
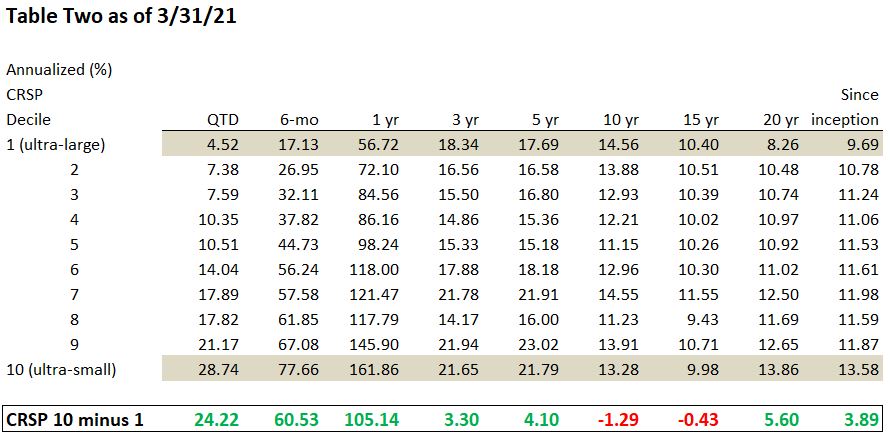
Source: CRSP
Despite the strong recent returns, note that the long-term, 10- and 15-year results are still negative as of the end of Q1 2021. The decade of underperformance suffered by small stocks has not yet fully recovered. Furthermore, one criterion that we use to judge a factor like size is that it be persistent, working across long periods of time.[6] This doesn’t mean that it should always work, as all factors go through periods where they lag. But after such weak periods, we should expect stronger performance so that returns provide the long-term expected premium. Having lagged by almost 1.3% over the last 10 years, small stocks would need to notably outperform large to get back to the historic premium seen since the inception of CRSP. There is indeed room to run. We’ll now turn to valuations to get an idea of how much.
Using the standard academic definition of valuation, “book-to-market,” we can examine both just how far out of favor small-value stocks became before March 2020 and how much they have come back.
The chart below shows the ratio of median book-to-market (BtM) for the Russell 2000 Value Index to median BtM for the S&P 500. The solid green line shows the median ratio for the entire history of the Russell 2000 Value, from 1978- Mar 2021. Ratios above this line signal that small-cap value stocks are cheaper than their historical average.
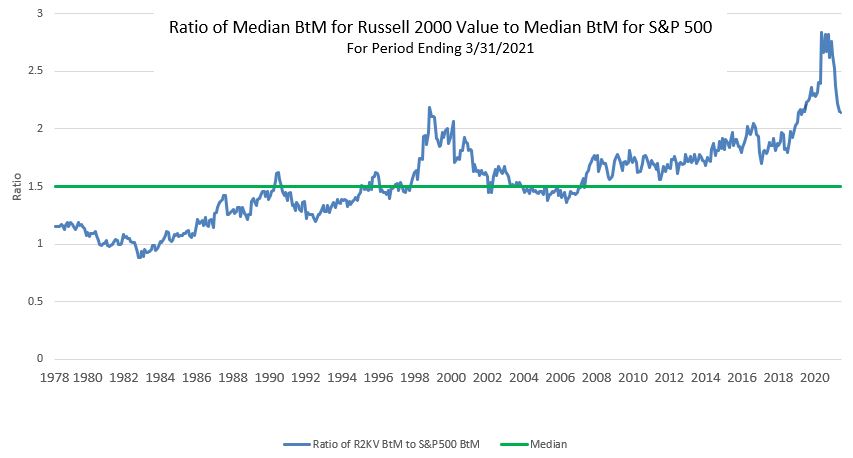
Source: Compustat, Bridgeway calculations
Indeed, the peak of small-value underperformance (low valuation) was at its worst (highest in the graph) in March 2020. While the graph shows a tremendous turnaround over the following 12 months, the recent relative valuation level on March 31, 2021, was still near the level of previous peaks since 1978. It’s also of note how quickly the turnaround occurred, concentrated primarily in the last six months.
So, where do we go from here? Holding book value constant and varying only the relative prices of small-value stocks, prices would have to rise 43% from their March 31, 2021 levels to return to the historical median ratio. In other words, we’ve still got quite a bit of open field in front of us, or “room to run ” relative to the S&P 500.
Does that mean we know the timing or can guarantee 2021 will continue to be a small-value-dominated year? No, we don’t, and we can’t (see below). We do believe that factors tend over time to revert to long-term historical levels. If this happened all in one year, it would mean a 43% tailwind in performance for small-cap value as measured by the Russell 2000 Value Index relative to the S&P 500 Index. If it happened over a five-year period, that would mean a 7.4% per year (compounded) tailwind. Over a ten-year period, a 3.6% per year tailwind. We believe these are very big numbers.
Is This a Timing Factor?
No. We don’t believe in timing the market at Bridgeway, though we do believe in managing risk. Note that the recent peak of relative valuation exceeded the prior peaks, and it can happen again. As John’s Harvard Business School professor used to say, “The problem is, a very cheap investment can always get cheaper.” But it’s also true that the pullback to historical factor norms is very strong. In this case, economic and market environment factors that might cause a further comeback of small and value factors include:
- A realization by investors of just how out of favor these factors became and still are
- A market correction, which sometimes has investors flock to cheaper market niches, as happened with small-value stocks in the bear market of 2000-2002
- A growth economy, which paradoxically helps value stocks, resulting from the pandemic recovery underway, the economic stimulus approved by Congress in March, and/or a $2 trillion infrastructure investment package introduced by President Biden in his April 28 “100 days” speech
- An increase in interest rates from current very low levels, which favors value stocks over growth stocks
Nevertheless, Bridgeway doesn’t believe in timing the market. Rather, we believe in establishing a long-term plan with specific factor exposures, sticking with the plan through thick and thin, and especially when it feels least comfortable to do so. We believe small-value stocks have an appropriate role in portfolios with a long-term investment horizon and that many investors, especially those who have not rebalanced back to appropriate target levels or who have followed the “investor herd” into attractive but overpriced large-growth stocks, are underexposed to small-value stocks today.
For a PDF download of this thought piece, please use the following link:
“Room to Run” with US Small-Cap Value Stocks?
[1] Small-value stocks and broader US market as represented by the Russell 2000 Value Index and S&P 500 Index, respectively
[2] In 2020, the Russell 1000 Growth index returned +38.49%, compared to the Russell 2000 Value Index returned +4.63%
[3] FANMAG stocks are Facebook, Apple, Netflix, Microsoft, Amazon, and Google
[4] See, for example, Fact, Fiction, and the Size Effect by Ron Alquist, Ronen Israel, and Tobias Moskowitz, Journal of Portfolio Management, Fall 2018; There Is No Size Effect: Daily Edition, Cliff Asness, AQR, September 18, 2020; and Settling the Size Matter, by David Blitz and Mattias Hanauer, Journal of Portfolio Management Quantitative Special Issue 2021
[5] Link: https://blogs.cfainstitute.org/investor/2018/08/09/growth-vs-value-waiting-for-godot/
[6] “See Your Complete Guide to Factor-Based Investing” by Andrew L. Berkin and Larry E. Swedroe
DISCLOSURE
The opinions expressed here are exclusively those of Bridgeway Capital Management (“Bridgeway”). Information provided herein is educational in nature and for informational purposes only and should not be considered investment, legal, or tax advice.
Past performance is not indicative of future results.
Investing involves risk, including possible loss of principal. In addition, market turbulence and reduced liquidity in the markets may negatively affect many issuers, which could adversely affect client accounts. Value stocks as a group may be out of favor at times and underperform the overall equity market for long periods while the market concentrates on other types of stocks, such as “growth” stocks.
Diversification neither assures a profit nor guarantees against loss in a declining market.
The S&P 500 Index is a broad-based, unmanaged measurement of changes in stock market conditions based on the average of 500 widely held common stocks.
The Russell 2000 Index is an unmanaged, market value-weighted index, which measures the performance of the 2,000 companies that are between the 1,000th and 3,000th largest in the market. The Russell 2000 Value Index measures the performance of those Russell 2000 companies with lower price-to-book ratios and lower forecasted growth values. The Russell 2000 Growth Index measures the performance of those Russell 2000 companies with higher price-to-book ratios and higher forecasted growth values with dividends reinvested.
The Center for Research in Security Prices (“CRSP”) US Stock Databases contain daily and monthly market and corporate action data for over 32,000 active and inactive securities with primary listings on the NYSE, NYSE American, NASDAQ, NYSE Arca, and Bats exchanges and include CRSP broad market indexes. CRSP databases are characterized by their comprehensive corporate action information and highly accurate total return calculations.
One cannot invest directly in an index. Index returns do not reflect fees, expenses, or trading costs associated with an actively managed portfolio.