
Andrew L. Berkin, PhD

Kai Liu, CFA
Key Points:
- As the largest stocks in the S&P 500 rise to historic levels, the effective number of stocks driving this index has fallen to below 50.
- Such concentration presents risks, and previous periods have been followed by weaker returns.
- Possibilities to mitigate this risk include large cap strategies with more equal weighting, better diversified and cheaper small cap value stocks, and alternative strategies independent of market direction.
How many stocks are effectively in the S&P 500 index of large cap stocks? Let’s start with a simpler question by removing “effectively”: how many stocks are in the S&P 500? Even this question is not straightforward, as stock indices don’t always have a count which matches the number in its name. The Wilshire 5000 is designed to represent the entire US stock market and has had notably greater or less than 5000 stocks. The Russell 1000 and 2000 indices have only roughly those numbers due to corporate actions and grandfathering rules. The S&P 500 does have 500 companies, but as of the end of 2024 had 503 holdings because three companies (Alphabet, Fox and News Corp) have multiple share classes in the index.
Now let’s return to the original question: how many stocks are effectively in the S&P 500? Because the S&P 500 is float weighted, larger stocks have a much greater weight than smaller stocks. These smaller stocks, some with weights just over 0.01%, have minimal impact on the characteristics and returns of the index. The largest stock, Apple, had a weight of 7.6% at the end of 2024, equivalent to the weight of the smallest 217 companies.
How can we measure the effective number of holdings? Statistics has an answer, based on the Herfindahl-Hirschman Index (HHI). While it sounds like a mouthful, the concept is straightforward, so bear with us for a moment. The HHI is a measure of concentration and is simply the sum of the weights squared, and can range from 0 to 1. The inverse of the HHI gives the effective number of holdings.
As an example, consider a portfolio of 10 stocks. If they have equal weight, each will be at 10% or 0.1 of the portfolio. Square 0.1 to get 0.01, then add up the 10 stocks to get an HHI of 0.1. Now invert the HHI: 1/0.1 is 10, which makes sense: each of the 10 stocks contributes equally. Next consider the case where one stock has 91% of the weight and the other nine stocks each have 1%. The HHI is now 0.83, indicating high concentration. Inverting it gives 1.2, barely over 1. The portfolio is dominated by the single large holding, with the other nine stocks having very small contributions.
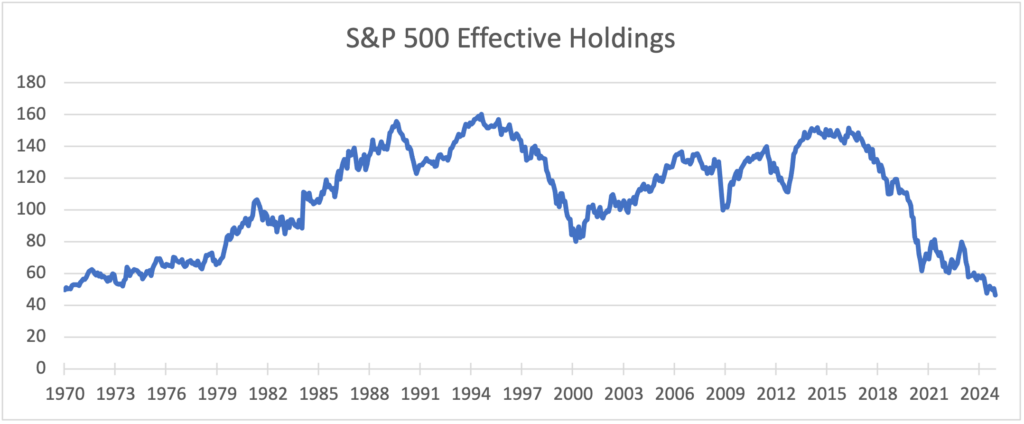
The plot below shows the effective number of stocks in the S&P 500 since 1970. We have treated multiple share classes as a single stock by adding their weights, since the two share classes provide exposure to the same company. To answer the question posed by the title of this piece, the effective number of stocks was just over 46 at the end of 2024. This is the lowest number in the last 55 years. Perhaps this is not too shocking when the “Magnificent Seven” stocks (Apple, Nvidia, Microsoft, Amazon, Alphabet, Meta and Tesla) have over a third of the total weight of the index. The plot shows two other periods of high concentration: the Tech Bubble of the late 1990s and the Nifty Fifty craze of the early 1970s. See our piece “Party Like It’s 1972” for a comparison of those episodes with recent events.
Why should an investor care about concentration? One important reason is that such a high weight in a few stocks leads to a greater influence on returns and reduces diversification, called the one free lunch in investing. If the returns of those higher weight stocks begin to lag, they drag down the returns of the entire S&P 500. Indeed, this is what we observe following past periods of high concentration.
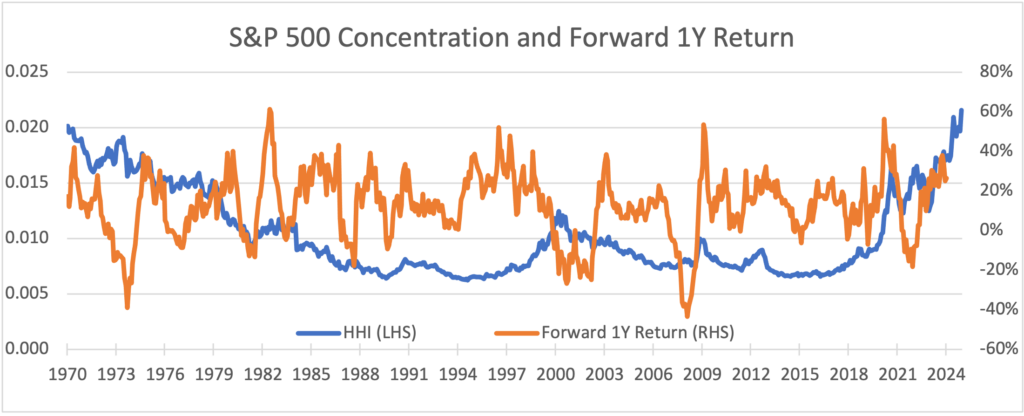
The graph below shows the HHI in blue on the left axis. Recall this measure of concentration is simply the inverse of the effective number of stocks. We see the current historic high concentration of the S&P 500, as well as peaks during the Nifty Fifty Craze and Tech Bubble. But these periods did not end well for investors, as we can see from the strongly negative returns in the early 1970s and early 2000s. And it was the stocks which had grown to be such a big weight in the index which led the way down. Note that the orange line of forward returns ends 12 months before the HHI. We don’t know what future returns will be, but the high concentration and low effective number of stocks in the S&P 500 could be viewed as a cautionary signal.
This is not a call to try to time the market. The plot does show that concentration and returns have fallen after reaching new highs, but both can keep increasing before that reversal. And other factors drive the market as well; there are jumps and falls unrelated to concentration. But history tells us that high concentration can be a warning sign. Investors may want to revisit their risk and return assumptions together with their portfolio allocations and consider appropriate actions.
What steps could investors take? One thought is to consider a large cap strategy with less concentration in the largest names. But there are caveats. An equal weighted S&P 500 offers the greatest diversification across these names, and since 1970 would have offered higher returns as well. However, giving the same weight to these 500 stocks both big and small gives the portfolio a more mid cap tilt. The weighted average market cap of the S&P 500 at the end of 2024 was over a trillion dollars[1]. For the equal weighted version, the average market cap was ten times less at about $100 billion dollars. But an equal weighted version of the largest 50 firms, roughly the number of effective holdings in the S&P 500, had an average market cap of $600 billion dollars. This is much closer to that of the index, and the weight of the Magnificent Seven is reduced to 14% from over a third.
Another suggestion is to revisit the allocation to small cap value stocks. One concern about such high concentration in the S&P 500 is that it also becomes quite expensive, with a P/E ratio at the end of 2024 of 27.4[2]. Not only is this quite high, but it is a very large spread compared to the P/E of the small cap Russell 2000 Value index at 13.8. While US stocks as a whole have gone up, the rally has been led by the mega cap growth stocks. Small value stocks still trade at quite reasonable valuations, with the smallest deep value names especially trading at a discount. Investors may want to revisit their allocation to this segment of the market. Similarly, international stocks also trade at discounted valuations to the S&P 500.
A final suggestion is to consider an allocation to alternatives which are uncorrelated to equities. Such strategies always have a potential role to play in a portfolio, with their diversification benefits. With the S&P 500 so highly concentrated and expensive, now is a particularly appropriate time for investors to reexamine their allocations within large cap stocks and to small value and international equities as well as to alternatives.
DISCLOSURES
The opinions expressed here are exclusively those of Bridgeway Capital Management (“Bridgeway”). Information provided herein is educational in nature and for informational purposes only and should not be considered investment, legal, or tax advice.
Past performance is not indicative of future results.
Investing involves risk, including possible loss of principal. In addition, market turbulence and reduced liquidity in the markets may negatively affect many issuers, which could adversely affect client accounts.
Diversification neither assures a profit nor guarantees against loss in a declining market.
The S&P 500 Index is a broad-based, unmanaged measurement of changes in stock market conditions based on the average of 500 widely held common stocks.
One cannot invest directly in an index. Index returns do not reflect fees, expenses, or trading costs associated with an actively managed portfolio.
[1] Source for market cap calculations: Refinitive, S&P Global Ratings, CRSP,Compustat and Bridgeway.
[2] Source for P/E ratios: FactSet and Bridgeway.