
Andrew L. Berkin, PhD

Sri Lakshmanan, CFA
Hot stocks, even if resulting from strong financial performance, do not guarantee investing success if their prices have been bid up too high.
Many commentators have compared the recent stock market to the Tech Bubble[1] of the late 1990s. But we see a similarity with a more distant epoch, namely the Nifty Fifty fad of the late 1960s and early 1970s. So rather than evoking the Tech Bubble and partying like it’s 1999, we wonder if today’s market is partying like it’s 1972.
Back in the late 90s, the market experienced a boom in IPOs of speculative internet firms without profits. Today, the new boom is Special Purpose Acquisition Companies (SPACs). Back in the late 90s, the market had a burst of retail trading through low-cost online brokerages. Today, it is even lower cost and more accessible stock trading through apps on mobile devices. Back in the late 90s, stock market valuations were in the stratosphere, with several mega-cap stocks comprising a large share of the S&P 500 index. Today, valuations are also sky-high, and both Apple and Microsoft are over 5% of the index as of September 30, 2021, and several others are not far behind. Certainly, today’s market has similarities with the late 90s, but today’s market leaders* arguably more closely resemble the Nifty Fifty.
*Market leaders refers to large-cap stocks with high recent returns. In this piece we specifically examine the FANMAG stocks defined below.
In the late 1960s and early 1970s, the Nifty Fifty were stock market darlings comprised of a set of roughly 50 large companies. Investing in these firms was not considered speculative, unlike many of the tech firms that dominated the headlines in the late 1990s. Instead, the Nifty Fifty were typically quite successful, with strong earnings growth and profitability. But a great company is not necessarily a great stock, and starting in 1973, their returns disappointed for years. We see strong similarities with the market’s leading stocks today.
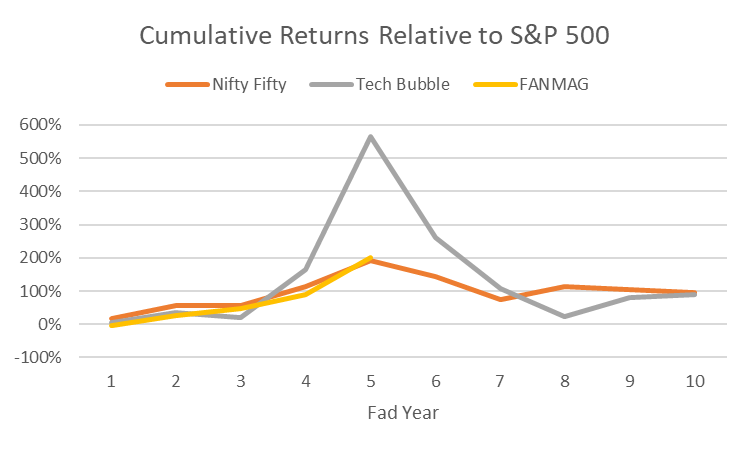
As an illustration, consider the plot above. It shows returns relative to the S&P 500 of these three sets of stocks from different eras: an equal-weighted composite of the Nifty Fifty stocks, Tech Bubble stocks proxied by the NASDAQ 100, and an equal-weighted composite of FANMAG, which is an acronym for six of today’s hottest stocks: Facebook, Apple, Netflix, Microsoft, Amazon, and Google. We show 10 years of returns, with year five set at the peak calendar years of 1972 and 1999. For FANMAG, year five is 2020. We don’t know what will happen to FANMAG from here, but we do believe in the quip ascribed to Mark Twain that “history doesn’t repeat itself, but it often rhymes.”[2] In the spirit of relational investing, we stay curious about what we see in the market. Therefore, we will compare the Nifty Fifty at their peak to FANMAG, showing how it provides a cautionary tale for today.
Nifty Fifty: Companies and Characteristics
There was never a fixed set of 50 companies comprising an “official” Nifty Fifty. Rather it was a designation given to a number of large-growth firms considered good investments and called one-decision stocks. Investors could supposedly buy them and never sell, despite high valuations. Siegel (1998) used 50 stocks identified by Morgan Guaranty Trust to claim that after 25 years, their returns justified those valuations. Fesenmaier and Smith (2002) pointed out that many of these stocks had more reasonable P/E ratios and thus might not be truly representative. Instead, they also considered a separate list provided by Kidder Peabody. They found that stocks on each list somewhat lagged the S&P 500 over the next 29 years; stocks on both lists underperformed more notably. Stocks with the highest P/E ratios had the lowest returns.
We examine the full set of stocks from both lists, a total of 76 names. 24 stocks were on both lists, termed the “Terrific 24” by Fesenmaier and Smith. That leaves 26 stocks on each of the Morgan Guaranty and Kidder Peabody lists that were not on the other. The ten largest stocks by market cap at the end of 1972 are shown in the table below. Most of these are still well-known names, although some such as Kodak and Sears have hit hard times. Younger folks might not recall having to buy and develop film. For that matter, the concept of a physical store may be a little fuzzy for the new generation. But that is part of the point about today’s hot stocks. In the future, the concept of buying items online or having a social network may seem equally quaint.
| RANK | NAME | SOURCE |
|---|---|---|
| 1 | Int’l Business Machines | Morgan Guaranty |
| 2 | Eastman Kodak Co. | Both |
| 3 | General Electric Co. | Morgan Guaranty |
| 4 | Sear Roebuck & Co. | Morgan Guaranty |
| 5 | Xerox Corp. | Both |
| 6 | Minnesota Mining & Manuf’g | Morgan Guaranty |
| 7 | Procter & Gamble Co. | Morgan Guaranty |
| 8 | Coca-Cola Co. | Both |
| 9 | Avon Products Inc. | Both |
| 10 | Johnson and Johnson | Both |
Returns and financial data come from CRSP and Compustat, respectively. While we now have almost 50 years of data since the apex of the Nifty Fifty at the end of 1972, our focus will not be on the super long term. Too many of those 76 stocks no longer exist, and any attempt at estimating returns for the group since 1972 involve assumptions about reinvesting when a stock vanishes because of bankruptcy, merger or acquisition. Instead, we look at their characteristics and returns in the years around the Nifty Fifty period.
And what a period it was for these stocks, at least initially. Through 1972 these firms had averaged over 22% annual earnings growth over the past five years, with over 30% growth in 1972. For the S&P 500, these numbers were just 4% and almost 13%, respectively.[4] These companies were profitable as well, with return on equity (ROE) over 22% on average, well above the historical ROE of 14% for the S&P 500.[5] Pretty nifty indeed! With financial results like these, investors flocked to these stocks, and at first, they were not disappointed. For the five years through 1972 average annual returns were almost 28%, with an average return of over 43% in 1972. In comparison, over the same five years, the S&P 500 averaged about 6.7%, with a return of just under 19% in 1972.
What could go wrong? Well, for one thing, these stocks had become quite expensive, with an average P/E of about 43 at the end of 1972. This was well more than double the P/E ratio of 18 for the S&P 500. And as noted, a great company is not necessarily a great stock. When a stock gets too expensive, it becomes prone to disappointment. The prices of the Nifty Fifty had become bid up amid expectations of continued exceptional growth, which proved unsustainable.
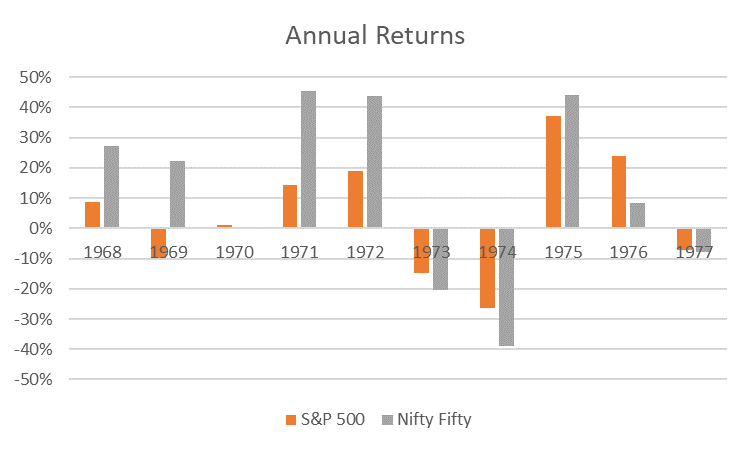
The recession of 1973 – 1975 ushered in a period of low economic growth, and with it a bear market. The chart below shows that the S&P 500 fell by over 14% in 1973 and lost over 26% in 1974. But the Nifty Fifty stocks fell even more, dropping over 19% and then 38% in those two years. Markets did recover somewhat after that, and the S&P 500 gained on average about 2.5% annually over the five years from 1973 – 1977. But the Nifty Fifty still lagged, with five-year average returns of -4.4%. Although not shown for brevity, those Nifty Fifty stocks with the highest P/E at the peak tended to have the lowest subsequent returns.
FANMAG Stocks
Fast forward to today, and once more, a set of great companies are also considered great stocks. We personally use the products and services of the FANMAG stocks, and we are not alone. For the five years through the end of 2020, these stocks had average annual earnings growth of almost 60%. For comparison, over this same time period the S&P 500 averaged not quite 4% annual earnings growth. A chunk of this difference is explained by the pandemic-induced recession of 2020 when S&P 500 earnings fell by over 32%.[6] In that same year, the FANMAG grew earnings by over 37%, led by Amazon at 84%. Just as with the Nifty Fifty decades earlier, profitability is also sky-high, with ROE averaging over 29% for the past five years.
What could go wrong for the FANMAG stocks? After all, they made it through a recession with flying colors, unlike the Nifty Fifty. But as Roseanne Roseannadanna said, “It’s always something.”[7] And something FANMAG has in common with the Nifty Fifty of yore are high relative valuations. At the end of 2020, the average P/E for the FANMAG stocks was over 48. This is not too much higher than the P/E for the S&P 500 of just over 39 from Robert Shiller’s data. The valuation for the broad market is currently inflated by the fall of earnings associated with the pandemic and the recovery of stock prices off bear market lows early in 2020 in expectation of a broad earnings recovery. Aside from the current COVID-influenced situation, relative valuations have recently been much further apart. For instance, at the end of 2019, the P/E for FANMAG was 43.5 while the S&P 500 was at 22.8.
One issue for stocks with high P/E ratios is that subsequent earnings can’t just be good, they have to continue to be great. From the peak of the Nifty Fifty, their earnings still tended to surpass those of the S&P 500. But they simply weren’t good enough to justify valuations. So what could cause problems for the growth of FANMAG earnings? One possibility is competition from other companies, as those who are out front have a visible target on their back. Another possibility is competition among themselves, as business lines increasingly overlap. A third possibility is lack of competition, as several governments investigate these firms for monopolistic behavior as well as privacy concerns.
We don’t know which of these it may be, if anything at all. After all, the FANMAG firms have made a number of deft moves over the years to reach the position they are in today. But another Wall Street saying is that trees don’t grow to the sky. As a company gets bigger and bigger, growth becomes harder to maintain. And one thing we do know from historical evidence is that those stocks with the highest growth expectations tend to lag over the long run, while value stocks tend to outperform. This is the basis for the value premium.
Key Takeaways
The FANMAG stocks that have led the market over the past several years are truly great companies. They are household names with products used by a large chunk of the population. This has enabled them to have remarkable earnings growth and valuations to match. But as we have seen before in eras such as the Nifty Fifty, a great company does not necessarily make a great stock. Exceptional growth is hard to maintain, and valuations matter. When a small set of stocks drives the market, subsequent returns have tended to ultimately disappoint. Investors may want to consider other market segments, such as smaller and cheaper stocks. And they certainly should consider a broader and well-diversified portfolio.
We certainly enjoy parties. But over the years, we have gained experience. When it gets too late or too exuberant, we decide to leave. We may miss out on some fun, but we also reduce our chances of a painful hangover the following day. Bear this in mind when you decide how to party as we head into 2022.
[1] The Tech Bubble, also known as the Dot-Com Bubble, was a stock market bubble caused by excessive speculation of Internet-related companies in the late 1990s, a period of massive growth in the use and adoption of the Internet.
[2] See https://quoteinvestigator.com/2014/01/12/history-rhymes/ for a discussion of the source of this quote.
[4] https://www.econ.yale.edu/~shiller/data.htm
[5] https://www.investopedia.com/terms/r/returnonequity.asp
[6] Calculated from the source in footnote 4.
[7] https://en.wikipedia.org/wiki/Roseanne_Roseannadanna
References
Fesenmaier, Jeff and Gary Smith. 2002. “The Nifty-Fifty Re-Revisited.” Journal of Investing 11 (3): 86-90.
Siegel, Jeremy. 1998. “Valuing Growth Stocks: Revisiting the Nifty Fifty.” AAII Journal October: 20-24.
DISCLOSURE
The opinions expressed here are exclusively those of Bridgeway Capital Management (“Bridgeway”). Information provided herein is educational in nature and for informational purposes only and should not be considered investment, legal, or tax advice.
Past performance is not indicative of future results.
Investing involves risk, including possible loss of principal. In addition, market turbulence and reduced liquidity in the markets may negatively affect many issuers, which could adversely affect client accounts.
Diversification neither assures a profit nor guarantees against loss in a declining market.
The S&P 500 Index is a broad-based, unmanaged measurement of changes in stock market conditions based on the average of 500 widely held common stocks. The Nasdaq-100 is a stock market index made up of 102 equity securities issued by 100 of the largest non-financial companies listed on the Nasdaq stock market. It is a modified capitalization-weighted index.
One cannot invest directly in an index. Index returns and references to specific company earnings and other financial metrics do not reflect fees, expenses, or trading costs associated with an actively managed portfolio.