
Cindy Griffin, CIPM

Jacob Pozharny, PhD
Executive Summary
Bridgeway’s goal to be an enduring firm and to serve our clients, colleagues, and community for the long term has led us to consider offering a number of different strategies over the years. Through the lens of relational investing, we have stayed curious and completed countless hours of research, continuously looking for the intersection of where our investment expertise lies and what strategies to offer that could best serve our clients. To that end, in early 2021, we launched our first non-US equity strategy, Bridgeway Emerging Markets Small-Cap. At that time, we felt there was compelling evidence that small-cap stocks in emerging markets were an attractive asset class and that Bridgeway is uniquely positioned to maximize the opportunities in this asset class. More than two years after the launch of our Emerging Markets Small-Cap strategy, we revisited the reasons why, and they still ring true today:
- Emerging markets small-cap equity has historically offered lower correlation not only to non-equity asset classes but also to other equity asset classes.
- Emerging markets small-cap equity offers more diversification compared to other equity asset classes due to a less concentrated universe and revenue that is typically locally sourced.
- Based on past history, active management has the potential to outperform in emerging markets small-cap equity.
- A systematic, quantitative process can assess opportunities in emerging markets small-cap equity efficiently.
- Relative to other equity markets, emerging markets small-cap equity currently has a more attractive value profile.
- Bridgeway’s history of closing strategies at responsible asset levels allows us to explore capacity-constrained areas such as emerging markets small-cap equity without compromising our investment philosophy or process.
- Bridgeway’s global research into intangibles and unique portfolio construction offers a novel approach to investing in non-US markets.
Comparing Emerging Markets Small-Cap Correlation
Much has been written about how the emerging markets equity asset class can be a good diversifier to other equity asset classes. This also holds true for emerging markets small-cap equity. The simplest way to confirm this is to view the correlation of the asset class versus other equity asset classes. We looked at rolling 36-month correlations using monthly returns for various MSCI indexes (to represent various equity asset classes) relative to the MSCI AC World IMI, an index that constitutes large-, mid-, and small-cap companies across 23 developed markets and 24 emerging markets. Since the common inception in 2001 of the indexes shown, the MSCI Emerging Markets Small Cap Index as a proxy for the emerging markets small-cap equity asset class has consistently been among the lowest correlated index relative to the MSCI AC World IMI.
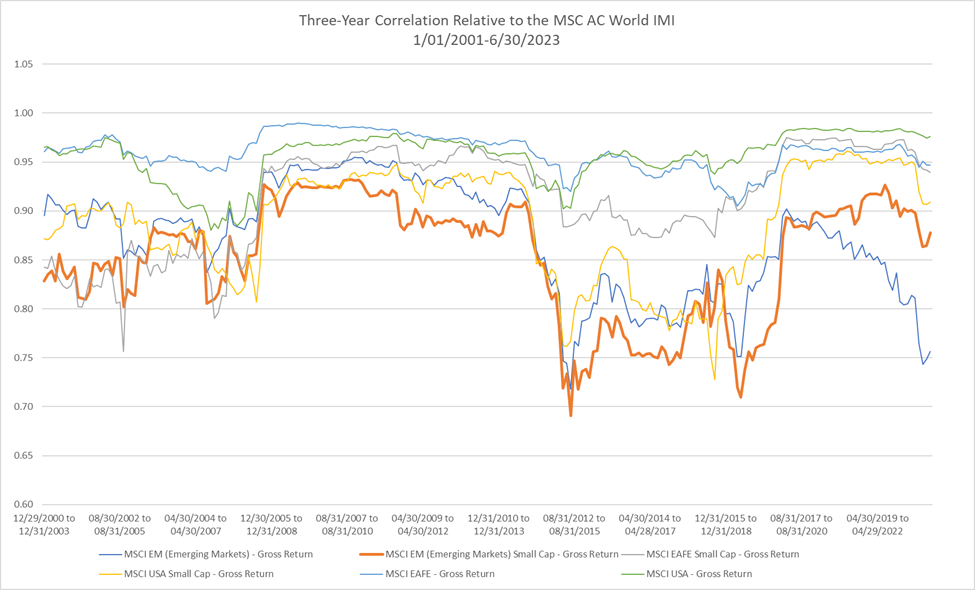
Source: FactSet; Returns for the MSCI Emerging Markets prior to June 2007 are back-tested performance and do not reflect actual index performance. Back-tested index performance was calculated retroactively to show how the index might have performed and may be materially different than actual results would have been.
However, for the most recent three-year period, the lowest correlation has been between the MSCI Emerging Markets Index to the MSCI AC World IMI. To what can we attribute this sudden dip? The primary reason is the large weighting that China has in the MSCI Emerging Markets Index versus the MSCI Emerging Markets Small Cap Index. The following table shows each index’s average weight to China and overall index return all for the three years ending June 30, 2023.
| Three Years as of 6/30/23 | Average Weight to China | Overall Index Cumulative Return (Net) |
| MSCI Emerging Markets Small Cap Index | 11.08% | 47.06% |
| MSCI Emerging Markets Index | 39.03% | 7.12% |
While the performance of Chinese stocks in the MSCI Emerging Markets Small Cap Index was worse on an absolute basis relative to the overall MSCI Emerging Markets Index, the lower weighting to China mitigated the negative effect to the overall performance of the MSCI Emerging Markets Small Cap Index. The MSCI Emerging Markets Index’s 3.5 times higher average weight to China had a significant negative effect on performance. This tells us that indeed, the MSCI Emerging Markets Index has lower correlation in the most recent period, but that correlation has come at a cost.
Viewing correlations for the MSCI Emerging Markets Small Cap Index versus various representative non-equity indexes shows that correlations are also low for this asset class relative to non-equity asset classes. And while some correlations have nominally crept up in recent years, the long-term correlations of the MSCI Emerging Markets Small Cap Index have remained low for longer time periods.
Correlation Relative to MSCI Emerging Markets Small Cap Index (Using Daily Returns) as of 06/30/2023
| Asset Class | Index Representative | 3 Year | 5 Year | 10 Year |
| US Broad Fixed Income | Bloomberg Barclays US Aggregate | 0.03 | 0.01 | -0.01 |
| US High Yield Fixed Income | Bloomberg Barclays US High Yield – Corporate | 0.50 | 0.62 | 0.58 |
| US Real Estate | MSCI US REIT INDEX – Gross Return | 0.22 | 0.38 | 0.33 |
| Commodities | S&P GSCI Total Return | 0.24 | 0.29 | 0.26 |
Lower correlations may also be attributed to larger differences in cyclical versus defensive sectors, which can – and have – driven differences in returns even within emerging markets. Comparing the sector weights of the MSCI Emerging Markets Small Cap Index versus the MSCI Emerging Markets Large Cap Index shows these stark differences. In the table below, cyclical sectors (Communication Services, Consumer Discretionary, Financials, Industrials, Information Technology, and Materials) had an average weight difference of 7.32%, while defensive sectors (Consumer Staples, Energy, Health Care, Real Estate, and Utilities) had an average weight difference of 3.10%. As these differences persist, correlations may remain lower particularly during different economic regimes, which provides good diversification opportunities for emerging markets small-cap.
| Sector Weights (%) As of 6/30/2023 | MSCI Emerging Markets Small Cap Index | MSCI Emerging Markets Large Cap Index | Absolute Difference |
| Industrials | 16.78 | 4.97 | 11.81 |
| Financials | 10.91 | 22.28 | -11.37 |
| Communication Services | 4.02 | 10.81 | -6.79 |
| Materials | 13.95 | 7.49 | 6.46 |
| Health Care | 8.89 | 2.79 | 6.10 |
| Information Technology | 17.09 | 22.49 | -5.40 |
| Real Estate | 6.14 | 1.35 | 4.78 |
| Energy | 1.77 | 5.30 | -3.53 |
| Consumer Discretionary | 11.10 | 13.20 | -2.10 |
| Utilities | 3.19 | 2.28 | 0.91 |
| Consumer Staples | 6.12 | 5.93 | 0.19 |
As seen above with China, another potential contributor to lower correlations and drivers to return within emerging markets small-cap is the difference in country allocations. An examination of country weights of the MSCI Emerging Markets Index versus the MSCI Emerging Markets Small Cap Index shows some stark differences.
Country Weights (%) as of 06/30/2023
| Country | MSCI Emerging Markets Small Cap Index | MSCI Emerging Markets Index | Absolute Difference |
| China | 8.07 | 29.55 | 21.48 |
| India | 24.23 | 14.63 | 9.61 |
| Taiwan | 21.81 | 15.60 | 6.21 |
| Korea | 14.99 | 12.30 | 2.69 |
| Thailand | 3.22 | 1.92 | 1.30 |
| Malaysia | 2.37 | 1.33 | 1.04 |
| Turkey | 1.48 | 0.55 | 0.92 |
| Mexico | 2.37 | 2.80 | 0.43 |
| South Africa | 2.78 | 3.21 | 0.43 |
| Saudi Arabia | 3.80 | 4.22 | 0.43 |
| Chile | 0.89 | 0.54 | 0.35 |
| United Arab Emirates | 0.96 | 1.30 | 0.34 |
| Philippines | 0.98 | 0.65 | 0.33 |
| Poland | 1.12 | 0.85 | 0.27 |
| Peru | — | 0.26 | 0.26 |
| Brazil | 5.80 | 5.54 | 0.26 |
| Kuwait | 1.05 | 0.83 | 0.22 |
| Hungary | 0.04 | 0.24 | 0.20 |
| Indonesia | 2.19 | 2.00 | 0.19 |
| Greece | 0.64 | 0.45 | 0.19 |
| Egypt | 0.26 | 0.08 | 0.18 |
| Czech Republic | 0.06 | 0.15 | 0.10 |
| Qatar | 0.83 | 0.90 | 0.07 |
| Columbia | 0.10 | 0.10 | 0.00 |
As with China, the other top two largest country weight differences – India and Taiwan – have had an outsized effect on performance (and thus correlations). In the last three years, India has had a staggering 122.58% return in the MSCI Emerging Markets Small-Cap versus the MSCI Emerging Markets India return of 72.68%. The difference in weightings have also affected performance and correlation with the MSCI Emerging Markets Small-Cap Index having nearly 10% more in India relative to the MSCI Emerging Markets Index. And while the returns for Taiwanese stocks were similar between the two Indexes, the large positive return and relative overweighting in the MSCI Emerging Markets Small-Cap Index had a positive effect. Like the differences in sectors, as these differences in country weights persist correlations may remain lower, and broader diversification opportunities across countries may continue to exist for emerging markets small-cap.
Active Management in Emerging Markets Small-Cap
The argument on whether to pursue an active versus passive approach in equity strategies has been long debated with strong proponents on each side. Each side has put forth compelling considerations. However, we believe that in the case of the emerging markets small-cap, active management has an edge over passive management. Historical evidence has shown that active management in emerging markets small-cap equity tends to well outperform a common benchmark, which is not always the case for other asset classes.
In the updated chart below, we show the excess annualized gross return over the long-term (10 years) of the median and top quartile institutional manager in four equity universes from the eVestment database: Global Emerging Markets Equity, and Global Emerging Markets Small Cap Equity, US Large Cap Core Equity, US Small Cap Core Equity against a common benchmark for each universe.

Source: eVestment, Bridgeway analysis; the eVestment universe median and top quartile calculation is using the default reporting method and default vehicle for all universe constituents to determine the median for each universe. The benchmark used for the Global Emerging Mkts Equity manager is the MSCI Emerging Markets Index Net; the benchmark used for the Global Emerging Mkts Small Cap Equity manager is the MSCI Emerging Markets Small Cap Index Net; the benchmark used for the US Large Cap Core Equity manager is the Russell 1000 Index Total Return; and the benchmark used for the US Small Cap Core Equity manager is the Russell 2000 Index Total Return.
Over this long-term period, the median Global Emerging Markets Small Cap Equity manager provides the highest excess performance of any of the other median managers shown relative to their benchmarks. Narrowing it down to the top quartile in each universe shows a similar pattern: the Global Emerging Markets Small Cap Equity manager has the highest excess performance of any of the other top quartile managers shown relative to their benchmarks. We believe this is strong evidence that persistent excess return in emerging market small-cap equity can be achieved with an active approach to management.
Is Emerging Markets Small-Cap an Attractive Asset Class Now?
More than two years has passed since we launched our own emerging markets small-cap strategy. At the time of launch, we believed it was an attractive asset class and continue to believe so now. However, a strong caveat: the question of whether to invest in any asset class at a particular time very often hints at market timing, something we do not suggest attempting. Even the most sophisticated investors would need to get the timing right multiple times for each asset class if a market-timing approach were implemented.
Nevertheless, asking the question of whether emerging markets small-cap is an attractive asset class now can be informative and assist with understanding how the asset class fits into an overall asset allocation. To do this, we plotted the distribution of tangible book-to-price ratios for the past 20 years and noted where each index stands as of June 1, 2023.

Source: FactSet, Bridgeway analysis
As the chart above on the left demonstrates, the MSCI Emerging Markets Small Cap Index generally has a distribution of book-to price ratios that are higher (meaning it represents a stronger value profile) than the other indexes represented. Further, within that distribution, the MSCI Emerging Markets Small Cap Index is currently cheap relative to its own history, making it an attractive opportunity for value investors. The chart on the right decomposes the MSCI Emerging Markets Small Cap Index into sectors and similarly plots the book-to-price ratios for each over the past 20 years. Except for the outlier of Information Technology, the chart shows that within MSCI Emerging Markets Small Cap Index, each sector is currently cheap relative to its own history demonstrating that the value opportunities in this space are broad based and not just driven by one particular sector.
For almost ten years, cheap stocks have lagged expensive stocks in terms of performance. This is a rare occurrence in the history of the market. Moreover, this trend is not limited to one region or country, but has affected the whole world. Therefore, we believe that emerging market small-cap stocks are poised to outperform, as they offer a great opportunity for value-focused investors. These stocks are currently trading at very attractive valuations, both compared to other global equities and to their own historical averages. Investors who are looking for the best bargains in the market should not miss the chance to invest in emerging markets small-cap stocks now.
Investing Quantitatively and Managing Capacity in Emerging Markets Small-Cap
In our 2021 piece, we discussed why a quantitative approach has some advantages over a non-quantitative approach. In summary, because a quantitative approach relies on data and can use modern programming and statistical analysis to evaluate companies, quantitative investment managers can cover the large number of names in the universe more quickly and efficiently than a non-quantitative manager. Further, because a quantitative approach allows an investment manager to cover all the names in the universe on a daily basis, there may be more potential opportunities for a quantitative investment manager than a non-quantitative manager may ever discover. Reviewing the data in eVestment appears to back up this hypothesis.

Source: eVestment, Bridgeway analysis; for each period, the average return of managers with a non-quantitative investment approach is subtracted from the average return of managers with a quantitative investment approach. The returns used are for the default reporting method and default vehicle for all universe constituents to calculate the average.
Over the trailing, 1-, 3-, 5-, and 10-year periods ending June 30, 2023, the average return for managers with a quantitative approach have outperformed their non-quantitative peers in the range of 1.01 – 4.47% annualized.
However, a good performing strategy is only good as long as it sticks to its mandate, which is why managing capacity is so important. At Bridgeway, we believe in doing what is best for the long-term interests of existing investors. This means that in asset classes that are capacity constrained, we will close at responsible levels in order to maintain the integrity of the investment process for our existing investors. Bridgeway has a history of closing strategies early to protect the process and existing investors, even when it means turning down large amounts of assets. In fact, in one of our most capacity-constrained strategies, we have been closed to new investors for more than a decade.
Bridgeway’s experience in managing assets in capacity-constrained asset classes can help successfully guide our experience in the emerging markets small-cap universe. Additionally, Bridgeway’s international equity team, led by our Co-CIO and Head of International Equity, Jacob Pozharny, PhD, has more than 25 years managing non-US equity strategies, including in capacity constrained asset classes. Along with the support and expertise of the entire investment management team at Bridgeway, this creates an experience in which our investors can be confident that we have their long-term interests in mind and that our investment philosophy and approach maintain integrity.
Bridgeway in Emerging Markets Small-Cap
In our last piece on “Why Emerging Markets Small-Cap?” we noted our innovative approach incorporating intangibles in our own Emerging Markets Small-Cap strategy. To summarize, we believe that equity price changes are driven primarily by financial fundamentals over the long run. However, as companies increasingly rely on intangible assets to drive business, we have seen these intangible assets displace traditional tangible, physical assets affecting financial statements. Based on our research, we believe that categorizing companies based on their Intangible Capital Intensity (ICI) has the potential to improve stock selection by using the most relevant metrics, particularly in non-US markets. Our framework for ICI is determined at the industry level, with high ICI industries having higher levels of intangible investment (e.g., pharmaceuticals, software, telecom services, media, etc.) while low ICI industries have lower levels of intangible investment (e.g., utilities, materials, capital goods, real estate, etc.). We then contextually apply factors like value, quality, sentiment, and trend to shape stock selection.
Bridgeway further differentiates our approach to investing in emerging markets small-cap stocks through portfolio construction innovation. We use a unique approach to invest in emerging markets small-cap stocks that focuses on both picking the best stocks and building the best portfolio, emphasizing both equally.
Our portfolio construction is driven by sizing index-relative exposures using an innovative technique we call Active Share Proportionality rather than classical mean-variance optimization. Our research indicates that off-the-shelf optimizers that are based on mean-variance optimization depend on the stability of a covariance matrix and use too much turnover to adapt the portfolio to noisy volatility estimates. Unlike most investors who rely on these standard tools that adjust the portfolio based on how stocks move together, we construct our portfolio in a differentiated manner. Our method of Active Share Proportionality allows us to size our systemic risks directly based on how much they proportionally differ from the index, rather than how much stocks vary with each other. This way, we seek to avoid the problems of using unreliable and changing estimates of stock correlations, which often lead to unnecessary trading and higher costs. By not requiring a covariance matrix estimate, our portfolio construction technique reduces turnover requirements and transaction costs, thus turnover exists primarily to express stock preferences rather than adapt to covariance noise.
This technique is geared to source active return from idiosyncratic elements rather than systematic risks. Our method helps us to reduce the impact of market-wide factors, such as country, sector, size, and Beta, and to increase the contribution of stock-specific factors, such as company fundamentals, growth, and sentiment, to our performance. By doing this, we aim to generate more consistent and diversified returns from our stock selection and mute systematic exposures to improve the risk-adjusted excess return of our portfolio.
Conclusion
We have demonstrated some convincing reasons to invest in emerging markets small-cap equity including an attractive value profile and diversification opportunity. Most convincing, though, may be the emerging markets share of global GDP and global GDP growth. Currently, emerging markets countries “account for 50% of Global GDP and 66% of global GDP growth in the past 10 years (2012-2022).”[1] With this kind of representation globally, it is likely that most investors are underallocated to emerging markets. This evidence should compel investors to look at emerging markets more closely and potentially as a larger portion of an overall allocation.
With the Bridgeway Emerging Markets Small-Cap strategy, we combine an attractive asset class with established experience, expertise, and a reputation for maintaining integrity by managing capacity responsibly. The Bridgeway Emerging Markets Small-Cap strategy lies squarely at the intersection of our investment expertise and how we can best serve our clients. We are confident we can offer a unique strategy in emerging markets small-cap equity with high conviction in our investment philosophy and process.
[1] https://www.worldeconomics.com/Regions/Emerging-Markets/
DISCLAIMER AND DISCLOSURE
The opinions expressed here are exclusively those of Bridgeway Capital Management (“Bridgeway”). Information provided herein is educational in nature and for informational purposes only and should not be considered investment, legal, or tax advice.
Past performance is not indicative of future results.
Investing involves risk, including possible loss of principal. In addition, market turbulence and reduced liquidity in the markets may negatively affect many issuers, which could adversely affect the strategy. Value stocks as a group may be out of favor at times and underperform the overall equity market for long periods while the market concentrates on other types of stocks, such as “growth” stocks. Emerging markets are those countries that are classified by MSCI as emerging markets and generally consist of those countries with securities markets that are less sophisticated than more developed markets in terms of participation, analyst coverage, liquidity, and regulation. These are markets that have yet to reach a level of maturity associated with developed foreign stock markets, especially in terms of participation by investors. These risks are in addition to the usual risks inherent in U.S. investments. There is the possibility of expropriation, nationalization, or confiscatory taxation, taxation of income earned in foreign nations or other taxes imposed with respect to investments in foreign nations, foreign exchange control (which may include suspension of the ability to transfer currency from a given country), default in foreign government securities, political or social instability, or diplomatic developments which could affect investments in securities of issuers in those nations. The government and economies of emerging markets feature greater instability than those of more developed countries. Such investments tend to fluctuate in price more widely and to be less liquid than other foreign investments. Investments in small companies generally carry greater risk than is customarily associated with larger companies. This additional risk is attributable to a number of reasons, including the relatively limited financial resources that are typically available to small companies, and the fact that small companies often have comparatively limited product lines. In addition, the stock of small companies tends to be more volatile and less liquid than the stock of large companies, particularly in the short term and particularly in the early stages of an economic or market downturn.
Diversification neither assures a profit nor guarantees against loss in a declining market.
The Bloomberg Barclays US Aggregate Bond Index is a broad-based flagship benchmark that measures the investment grade, US dollar-denominated, fixed-rate taxable bond market. The index includes Treasuries, government-related and corporate securities, MBS (agency fixed-rate and hybrid ARM pass-throughs), ABS, and CMBS (agency and nonagency). Provided the necessary inclusion rules are met, US Aggregate-eligible securities also contribute to the multicurrency Global Aggregate Index and the US Universal Index, which includes high yield and emerging markets debt.
The Bloomberg Barclays US Corporate High Yield Bond Index measures the USD-denominated, high-yield, fixed-rate corporate bond market. Securities are classified as high yield if the middle rating of Moody’s, Fitch and S&P is Ba1/BB+/BB+ or below. Bonds from issuers with an emerging markets country of risk, based on the indices’ EM country definition, are excluded. The US Corporate High Yield Index is a component of the US Universal and Global High Yield Indices.
The MSCI EAFE Index is an equity index which captures large and mid cap representation across 21 Developed Markets countries around the world, excluding the US and Canada. With 874 constituents, the index covers approximately 85% of the free float-adjusted market capitalization in each country.
The MSCI EAFE Small Cap Index is an equity index which captures small cap representation across Developed Markets countries around the world, excluding the US and Canada. With 2,354 constituents, the index covers approximately 14% of the free float-adjusted market capitalization in each country.
The MSCI Emerging Markets Index captures large and mid cap representation across 27 Emerging Markets (EM) countries. With 1,381 constituents, the index covers approximately 85% of the free float-adjusted market capitalization in each country. Net total return represents reinvested dividends after the deduction of withholding taxes, using a tax rate applicable to non-resident institutional investors who do not benefit from double taxation treaties.
The MSCI Emerging Markets Small Cap Index includes small cap representation across 27 Emerging Markets countries. With 1,692 constituents, the index covers approximately 14% of the free float-adjusted market capitalization in each country. The small cap segment tends to capture more local economic and sector characteristics relative to larger Emerging Markets capitalization segments. Net total return represents reinvested dividends after the deduction of withholding taxes, using a tax rate applicable to non-resident institutional investors who do not benefit from double taxation treaties. The MSCI US REIT Index is a free float-adjusted market capitalization weighted index that is comprised of equity Real Estate Investment Trusts (REITs). The index is based on the MSCI USA Investable Market Index (IMI), its parent index, which captures the large, mid and small cap segments of the USA market. With 137 constituents, it represents about 99% of the US REIT universe and securities are classified under the Equity REITs Industry (under the Real Estate Sector) according to the Global Industry Classification Standard (GICS®), have core real estate exposure (i.e., only selected Specialized REITs are eligible) and carry REIT tax status.
The MSCI USA Index is designed to measure the performance of the large and mid cap segments of the US market. With 620 constituents, the index covers approximately 85% of the free float-adjusted market capitalization in the US.
The MSCI USA Small Cap Index is designed to measure the performance of the small cap segment of the US equity market. With 1,741 constituents, the index represents approximately 14% of the free float-adjusted market capitalization in the US.
The S&P GSCI index measures commodity market performance through futures. The S&P GSCI is weighted by world production and comprises the physical commodities that have active, liquid futures markets. There is no limit on the number of commodities that may be included in the S&P GSCI; any commodity whose contract satisfies the eligibility criteria and the other conditions specified in this methodology are included.
The Russell 1000 Index includes approximately 1,000 of the largest companies in the US equity universe. It includes approximately 1,000 of the largest securities based on a combination of their market cap and current index membership. The Russell 1000 Index is constructed to provide a comprehensive and unbiased barometer for the large-cap segment and is completely reconstituted annually to ensure new and growing equities are included.
The Russell 2000 Index measures the performance of the small-cap segment of the US equity universe. The Russell 2000 Index includes approximately 2,000 of the smallest securities based on a combination of their market cap and current index membership. The Russell 2000 is constructed to provide a comprehensive and unbiased small-cap barometer and is completely reconstituted annually to ensure larger stocks do not distort the performance and characteristics of the true small-cap opportunity set.
One cannot invest directly in an index. Index returns do not reflect fees, expenses or trading costs associated with an actively managed portfolio.