
Andrew L. Berkin, PhD

Cindy Griffin, CIPM
One of the important concepts underpinning Bridgeway’s investment philosophy is that strong factor exposure and diversification improve portfolios. When we talk about diversification, we mean not just across differing factors, but diversification also within the factor itself. Bridgeway’s more than two decades of research has shown us that factor definitions matter. But with the past decade of underperformance of the value factor, how much have different definitions mattered? Below, we look at the historical evidence for investing in the value factor and why different factor definitions have mattered less in the most recent period, one of value’s defining moments in history.
The past decade has not been kind to value investors. From 2010 through 2019, value stocks lagged growth stocks by an average of 2.61% a year.1 Such returns are in contrast to history, where value has outperformed growth 93% of the time over rolling 10-year periods going back to 1926. As of March 31, 2020, the market remained in the other 7% of the time where growth beats value. For investors who believe in value, it does not feel good. However, this underperformance is not unprecedented nor should it be a surprise. In response to this rare period, academics and ardent value investors have been taking deep dives into the factor itself and this has led many to question whether value is being measured correctly.
There are a number of different ways to measure value, and each metric has a number of variations. Each of these metrics captures a different aspect of value. As firm believers in the power of diversification to help strengthen portfolios, we believe that diversification extends to using multiple ways to measure value. We also believe the details in the definitions of these metrics can matter as well. But in the recent environment, such differences in definitions did not overcome the difficulties that value has faced, as we will see below.
A value metric typically compares two parts: a measure of what the market will pay, such as current share price, and a measure of worth, such as earnings per share. Dividing them gives the price-to-earnings or P/E ratio. By this measure, a value stock typically offers a higher amount of earnings for a lower price. Price-to-book is another value measure commonly used by both practitioners and academics that uses the book value of assets to measure worth. For both metrics, when the price goes lower, the stock becomes deeper value or cheaper. Thus, value investing often involves buying stocks that have been beaten down for some reason. That reason may vary from stock to stock, but whatever the cause, it acts as the risk element in a risk premium that ultimately could be rewarded.
However, there is another proxy for value that does not involve a measure of worth: long-term reversals. The first thing to understand about long-term reversals is the concept that stock returns tend to continue in the same direction over intermediate horizons such as one-year, giving rise to the momentum factor. With long-term reversals, looking back over longer periods, such as five years, we see that returns tend to revert. Past losers go on to outperform while past winners subsequently lag. Long-term reversals tend to be a good proxy for value because just as with measures that incorporate metrics of worth such as price-to-book, both share the feature of a beaten down stock price, which has made the stock cheap.
The chart below shows the long-term performance for price-to-book and long-term reversals for ten-year rolling periods. For each metric, we plot the excess returns of the top 30% of value stocks relative to the bottom 30%. As can be seen, the two sets of historical returns tend to resemble each other. Long-term reversals are indeed a reasonable proxy for value. The chart provides a few key take-aways to emphasize.
First, both sets of lines are typically above zero, indicating a positive excess return for that measure. Value tends to work! But sometimes the performance dips into negative territory. As noted earlier, value does sometimes lag even over ten-year horizons, and we are currently experiencing one of those times. But value has always recovered, and that recovery historically has been sudden and strong. A recent example of this occurred in the aftermath of the internet bubble, when price-to-book value’s 10-year returns went from lagging growth by 1.75% annually in early 2000 to beating it by 6.79% annually at the end of 2001.
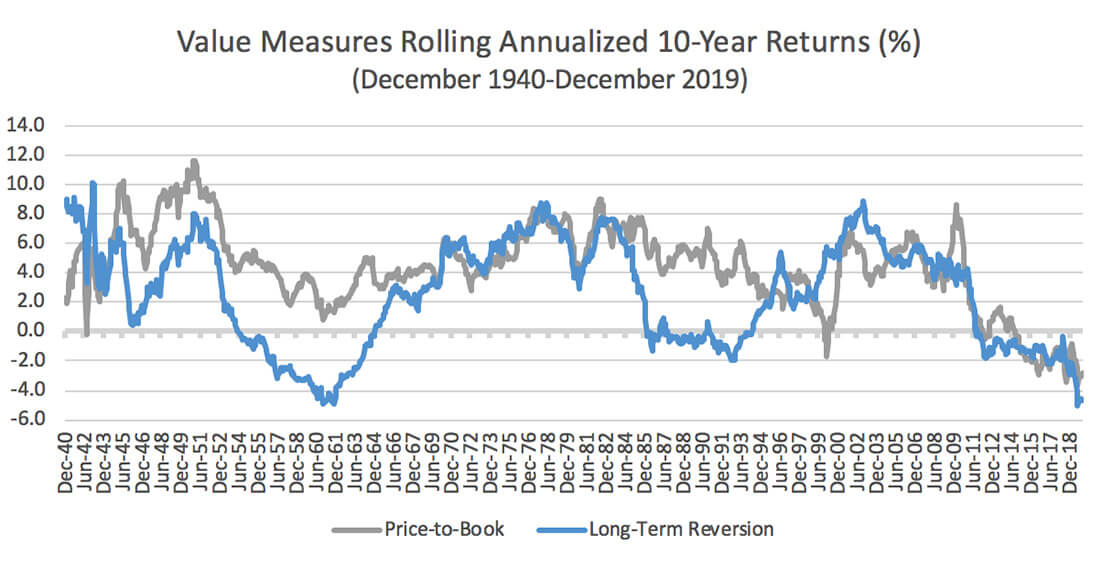
Source: Ken French Data Library
Next, the line for price-to-book is typically above that of long-term reversals. As we see, on average, including a measure of worth with a price-based measure helps to give a better value metric. This is true of other measures of worth as well, such as those based on earnings and cash flow. In keeping with Bridgeway’s strong belief in diversification, we use a combination of various measures to get exposure to the value factor.2
Finally, the right side of the plot shows that it has not been a pretty decade for value. Some have argued that the problems with value are because of how it is measured and have suggested various refinements. But in recent years, despite long-term reversals not having a worth component, the performance of value stocks as measured by price-to-book or long-term reversals looks quite similar. We see the same behavior using other worth measures besides book value.3 What this implies is that value’s recent underperformance is less about how that worth aspect is measured. Instead, it is the price aspect. What has been beaten down and become cheap has not bounced back as it historically has, but instead has continued to be beaten down further and become even cheaper.
As noted earlier, we at Bridgeway believe that how a financial metric is measured does matter, as does how it is combined and put into use. For value, these differences have mattered less of late, but using decades of data as our guide, we remain confident for the future. This underperformance of value has happened before; it is part of the “risk” aspect of risk premium that ultimately has been rewarded over time. And while value has lagged, it has become even cheaper, reaching valuation spreads that are historically large relative to the rest of the market and creating attractive opportunities as such extreme cheapness has ultimately been highly rewarded in the past. If history were to repeat itself, the underperformance of value today puts the odds in favor for stronger performance in the future. However, keep in mind with all of this research, the market volatility associated with the COVID-19 pandemic is not yet fully known.
Key Takeaways
- The long and deep drawdown of value is not surprising; it has happened before with both value and other factors, although the current volatility is fairly uncommon.
- Historical evidence for value gives us optimism for the coming decade.
- Differing definitions of value have mattered less in the most recent period as a lot of what was cheap has become cheaper regardless of value measure.
- Current valuations are creating attractive opportunities for potential future outperformance.
1 All data referenced is from the Kenneth R. French Data Library.
2 Contact us for more insights into the potential benefits of diversification of value measures.
3 Not shown for brevity.
DISCLAIMER
The opinions expressed here are exclusively those of Bridgeway Capital Management (“Bridgeway”). Information provided herein is educational in nature and for informational purposes only and should not be considered investment, legal, or tax advice.
The Russell 1000 Growth Index measures the performance of the large-cap growth segment of the U.S. equity universe. It includes those Russell 1000 companies with higher price-to-book ratios and higher forecasted growth values. The Russell 1000 Growth Index is constructed to provide a comprehensive and unbiased barometer for the large-cap growth segment. The Index is completely reconstituted annually to ensure new and growing equities are included and that the represented companies continue to reflect growth characteristics.
The Russell 1000 Value Index measures the performance of the large-cap value segment of the U.S. equity universe. It includes those Russell 1000 companies with lower price-to-book ratios and lower expected growth values. The Russell 1000 Value Index is constructed to provide a comprehensive and unbiased barometer for the large-cap value segment. The Index is completely reconstituted annually to ensure new and growing equities are included and that the represented companies continue to reflect value characteristics. It is not possible to invest directly in an index.
Investing involves risk, including possible loss of principal. Diversification neither assures a profit nor guarantees against loss in a declining market.