
Jacob Pozharny, PhD

Andrew L. Berkin, PhD
Bridgeway’s research leads to a new framework for addressing intangible assets in equity portfolios.
Stay curious is one of Bridgeway’s principles of relational investing.1 In keeping with our principles, our team has investigated and developed a new framework for analyzing intangible assets in equity portfolios. For decades, equity investors have relied on stock valuations, as well as the growth, profitability, and risk characteristics of companies. Yet the economy has undergone structural changes in recent years that have opened up opportunities for investors seeking to enhance their investment strategies.
Specifically, companies increasingly rely on intangible assets to drive their business models. Across a broad swath of industries around the world, we’ve seen intangible assets displacing traditional, physical assets on corporate balance sheets and affecting income statements. What’s more, differences in accounting standards between the US and international markets mean that companies are not following the same requirements for expensing or capitalizing many types of spending that create intangible assets, creating potential differences in statements of a company’s book value.
In response to this trend, investment researchers and practitioners have been investigating the potential impact of intangibles on stock prices. Some studies have attempted to quantify the impact of spending on intangibles on contemporaneous stock prices and future returns. Other studies have looked at techniques for adjusting fundamental metrics to account for the effects of specific types of intangibles. Above all, most research has focused only on US stocks, and international research on this issue is sparse. For Bridgeway’s detailed review of existing research into the effect of intangible assets on stock prices, please request a copy of our white paper “Equity Investing in the Age of Intangibles” by Amitabh Dugar and Jacob Pozharny.
As Bridgeway began designing our international developed and emerging market equity strategies, we saw an opportunity to investigate a different approach for dealing with the rise of intangible assets. Rather than attempting to adjust valuation metrics, we explored the idea of analyzing and ranking companies based on the degree to which they create and rely on intangible assets—known as Intangible Capital Intensity. And we included a global set of companies in our study. That way, we could then examine which fundamental metrics are most relevant for various companies and industries according to their degree of Intangible Capital Intensity.
Our research in this area has allowed us to create a new composite metric we call Intangible Capital Intensity. We believe this framework is flexible enough to accommodate different forms and magnitudes of intangible capital across the global economic landscape, and capable of evolving through time to reflect structural changes in the economy. We also discovered that this ranking system may be especially useful for international investors, because the impact of Intangible Capital Intensity on the association between stock prices and fundamental financial variables such as earnings and book value is strongest for international companies.
Defining Intangible Capital Intensity Metrics
Based on our study of accounting theory and our review of existing intangible research, Bridgeway designed its Intangible Capital Intensity composite to capture the impact of three types of intangible capital:
- Intangible assets reported on the balance sheet (excluding goodwill)
- Innovation capital created by research & development expenditures
- Organization capital resulting from sales, general & administrative expenses.
Intangible Assets (Excluding Goodwill)
In theory, any intangible assets reported on the balance sheet are already included in book value, so it may seem counterintuitive to include them in a composite Intangible Capital Intensity measure. In practice, however, spending on these intangible assets can still understate a company’s book value because those expenditures—and their impact on earnings—have increased dramatically. For example, the Telecom Services industry has had some of the highest growth in intangible assets on the balance sheet. This reflects spending on assets such as wireless licenses and subscriber lists, and costs of customer retention. We also reviewed research evidence from around the globe demonstrating that several types of intangible expenditures that were capitalized and reported on the balance sheet were value relevant, both in aggregate and individually.2
We choose to exclude goodwill from our measurement because our objective is to focus on forms of intangible capital investments that have become more important amid the rapid transformation in corporate investment and business models during the past few decades; in contrast, goodwill is an accounting by-product of business combinations. In addition, prior evidence regarding the value relevance of goodwill is mixed.
Research & Development Expenses
While US accounting standards require the cost of both research and development (R&D) to be expensed, International Financial Reporting Standards (IFRS) are a bit less restrictive, allowing the capitalization of development costs. Nevertheless, we see evidence in both international and US research to indicate that R&D expenditures create (intangible) innovation capital that is reflected in equity market values.3
Sales, General & Administrative Expenses
Viewed broadly, expenditures to create intangible capital can lead to a variety of assets such as human capital, customer lists, and proprietary IT systems/software that enhance efficiency, productivity, sales, or customer satisfaction. Sales, General & Administrative (SG&A) expenditures may capture many of these types of intangible capital— collectively dubbed as organization capital.
Our framework seeks to measure the recorded intangible assets, innovation capital, and organization capital (i.e., the composite Intangible Capital Intensity) of firms around the globe in all industries, excluding banks, insurance and diversified financials. We excluded these three industries because their atypical financial reporting practices affect the metrics, we use to gauge Intangible Capital Intensity. For example, due to the nature of their business, banks bundle and report several types of operating expenses in the category of SG&A expenses.
Ranking Industries According to Intangible Capital Intensity
To create our Intangible Capital Intensity composite rankings, we examined a global sample of companies from among the top 15 countries in the world ranked by their 2018 GDP (according to the World Bank). For each of those companies, we computed total intangible assets excluding goodwill relative to total assets; and research & development and SG&A expenses relative to total revenues for the years 1992-2018.4
Those company-specific calculations allowed us to compute the median Intangible Capital Intensity for our three metrics across all firms within each of 21 GICS industries, so we could rank those industries annually according to their median Intangible Capital Intensity in both the US and international markets. Finally, we combined each industry’s annual rank on the three Intangible Capital Intensity metrics to obtain its equally weighted composite Intangible Capital Intensity rank for each of the 27 years in our sample period. Tables 1 and 2 show the 27-year average composite Intangible Capital Intensity ranking of industries for the US and international investment universes. You’ll see that the order of industries according to their average composite Intangible Capital Intensity ranks is remarkably similar.
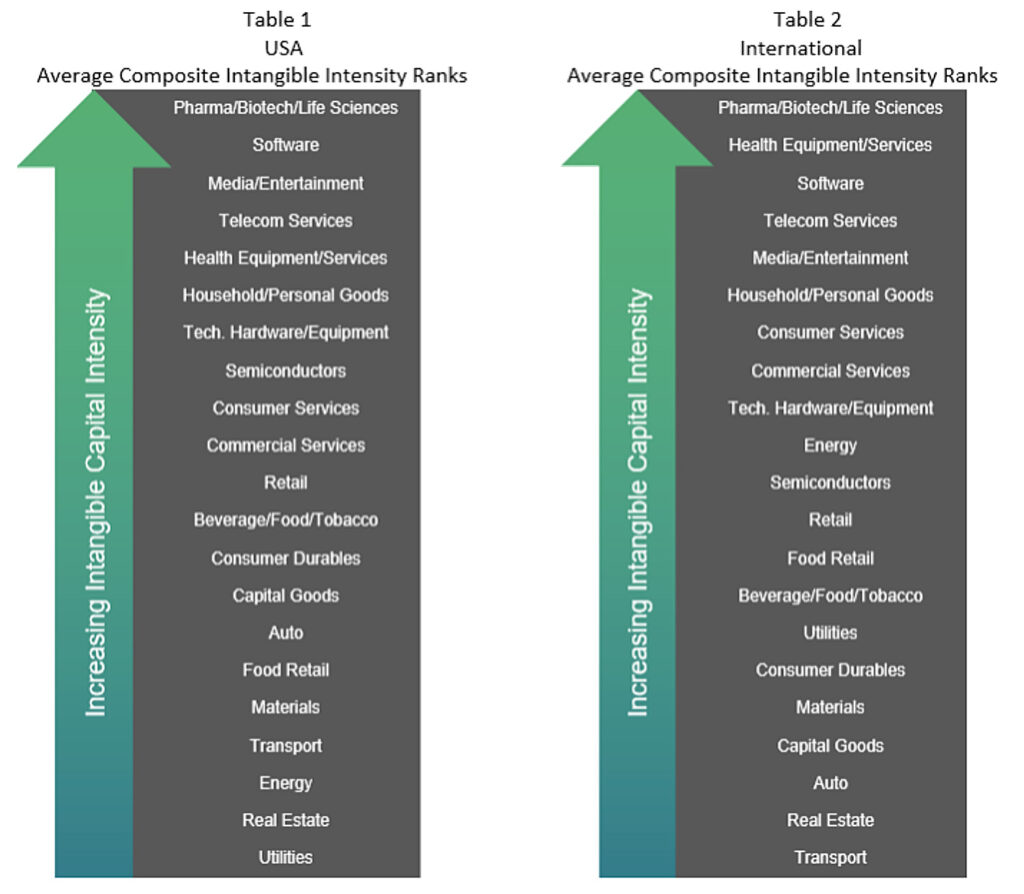
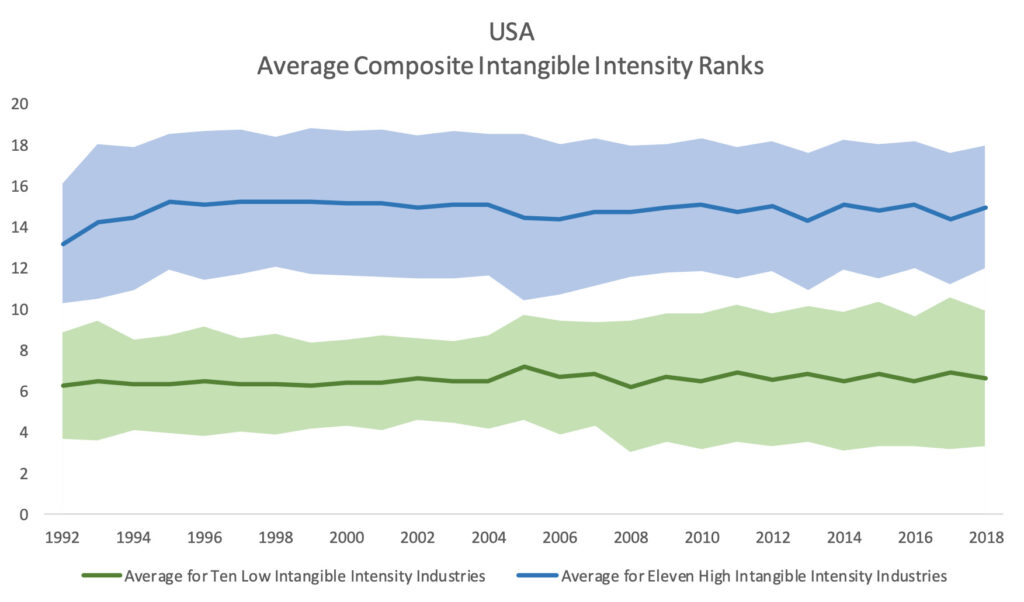
The results in Tables 1 and 2 demonstrated to us that these intangible metrics are pervasive. We also found that the average of the 21 industries were remarkably consistent over time. Figures 1 and 2 below show the 27-year trend of those average ranks within a one standard deviation band. This is an important finding, because the pace of evolution of Intangible Capital Intensity for each industry and for each type of intangible capital varies during that decades-long time period. Because of that persistence, we believe that our composite measure of Intangible Capital Intensity provides some assurance that investment strategies based on the choice or weighting of factors according to Intangible Capital Intensity are likely to be stable and replicable.
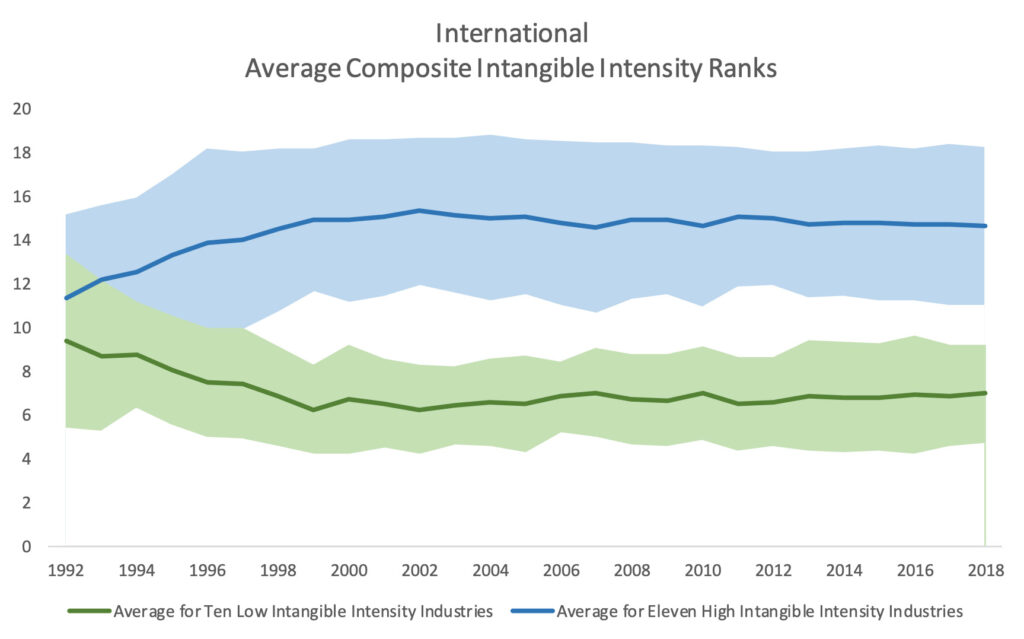
Despite these similarities in the average Intangible Capital Intensity, we also observed a key difference: The difference in the book value and earnings to explain contemporaneous stock prices in high versus low Intangible Capital Intensity groups is greater in international markets than in the US market.5 That divergence has also become greater among international companies, while it has remained stable in the US. Therefore, this framework may be especially useful for international investment strategies that want to adapt traditional equity investment analysis techniques to handle the effect of variations in Intangible Capital Intensity across firms and industries within the confines of the current financial reporting framework.
The Benefits of Categorization
Bridgeway’s research on intangibles makes three important contributions. First, because investors rely on book value and earnings to assess valuation ratios and various profitability, growth, and risk measures, our research finding that the relationship between these financial variables and contemporaneous stock prices has weakened for high Intangible Capital Intensity companies and has implications for many types of investment strategies. Second, our finding that this has occurred for both US and international companies in the largest fourteen economies of the world is a noteworthy advancement. Third, our composite measure of Intangible Capital Intensity captures the aggregate impact of three different types of intangible capital and can help investors consistently rank and classify industries over time and across countries.
Our research provides a repeatable framework to help investors choose or weight factors based on Intangible Capital Intensity when constructing global investment strategies. Importantly, our conclusions about the impact of Intangible Capital Intensity on the relevance of earnings and book value are stronger for international companies in that the divergence between the low and high Intangible Capital Intensity groups of industries is greater and has continued to increase over time.
Thus, our research shows that the Intangible Capital Intensity composite can be an effective tool for our international and emerging market equity strategies. That work has also laid the groundwork for further areas of research, motivated by a variety of questions. Can equity investors improve their assessments of a firm’s profitability, quality, growth, and risk by accounting for cross-sectional variations in Intangible Capital Intensity? Do we expect performance of value, quality and trend factors to be different based on Intangible Capital Intensity category? How should an investment manager think about factor applications using an Intangible Capital Intensity framework? Based on the broad relevance of this topic for investors, we believe these are important questions to study. As the economic landscape continues to emphasize intangible assets in addition to physical ones, investors will increasingly need new insights to help guide investment strategies, and Bridgeway will stay curious in line with our principles of relational investing.
For a PDF download of this thought piece, please use the following link: https://bridgeway.com/wp-content/uploads/2021/01/Intangible-Intensity-Paper-FINAL-20200119.pdf
1Relational investing bridges the gap between results for investors and returns for humanity with a modern approach to asset management. As a leader in relational investing, Bridgeway takes a statistical, evidence-based investment approach motivated by a passion for servant leadership and global impact which we accomplish by donating 50% of our firm profits to organizations making a positive impact for humanity.
2Oliveira, Rodrigues and Craig (2010) for a sample of Portuguese firms, Ritter and Wells (2006) and Dahmash, Durand and Watson (2009) for the Australian market, and Lev and Aboody (1998) in their study of capitalized software development costs in the US.
3Ahmed and Falk (2006) for a sample of Australian firms, Zhao (2002) for firms in France, Germany, UK and US, Smith, Percy and Richardson (2001) based on data from the Australian and Canadian markets, and the seminal paper by Lev and Sougiannis (1999), who estimate the R&D capital of a sample of more than 800 manufacturing companies.
4Analysis begins in 1992 as the company-level financial statement data available in S&P Capital IQ’s database was insufficient to permit construction of reliable intangible intensity ranks for prior years.
5For more detail and supporting evidence, please request Bridgeway’s white paper “Equity Investing in the Age of Intangibles”.
Disclosures
The opinions expressed here are exclusively those of Bridgeway Capital Management (“Bridgeway”). Information provided herein is educational in nature and for informational purposes only and should not be considered investment, legal, or tax advice.
Investing involves risk, including possible loss of principal. In addition, market turbulence and reduced liquidity in the markets may negatively affect many issuers, which could adversely affect investor accounts. Value stocks as a group may be out of favor at times and underperform the overall equity market for long periods while the market concentrates on other types of stocks, such as “growth” stocks. International stocks present additional unique risks including unstable, volatile governments, currency risk and interest rate risks.
Diversification neither assures a profit nor guarantees against loss in a declining market.