
Andrew L. Berkin, PhD

Christine Wang, CFA, CPA
Key Points:
- While stocks have recently seen some big down days, these are hardly unprecedented but rather typical given the volatility of equities.
- Short-term downturns in the market tell us very little about future returns; stocks tend to go up over time but with a wide variation of outcomes, no matter what recent returns have been.
- Setting an appropriately diversified asset allocation can help an investor bear the inevitable down days and reap the long-term rewards from holding stocks.
As we write this in early August 2024, markets have recently suffered some large drops. On Thursday August 1 and Friday August 2, the S&P 500 fell 1.37% and 1.84%, followed by a drop of 2.99% on Monday August 5. This was the worst single day return in almost two years and resulted in a three-day loss of just over 6%. As is typical, a variety of reasons have been given, but they seem to center around the Federal Reserve being late in cutting rates as job data weakens, leading to worries about increased chances of a recession. So just how bad is this? And more importantly, what does it mean for the future? To help answer these questions, we turn to historical data.
In some ways, these returns were indeed pretty bad. The one- and three-day returns were both in the worst 1% historically, going back to the start of 1970[1]. And indeed, this was the worst one-day return since September 13, 2022, when the S&P fell 4.32%. On the other hand, these falls are not too bad either. With over 200 trading days in a year, we could naively expect a couple of days a year in the worst 1%. Drops of 3% or 6% are not desirable, but neither are they too extreme. A drop of 10% from a recent peak is typically called a correction, while 20% or more is a bear market. We’re not at those levels. For that matter, does anyone remember what triggered the one-day drop of over 3% two years ago? We sure don’t. While stock markets generally go up over time, it is not in a straight line; one needs to expect some down days.
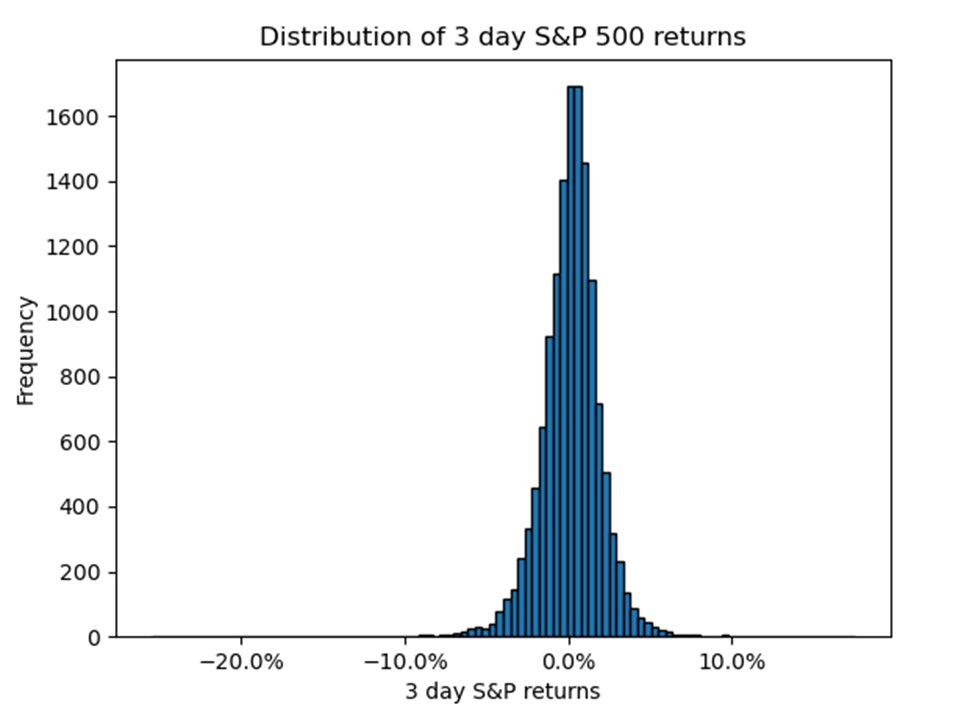
To get a more complete view of returns over time, the first exhibit shows the distribution of historical three-day returns. The vertical axis gives the count of returns that fall within a given range as shown on the horizontal axis. Over 99% of three-day returns are within +/- 6%; the recent drop we experienced is poor but not a huge outlier. Virtually all returns are within +/- 10%, but the horizontal axis extends further out because there are a few extreme outliers. The worst three-day return was an over 25% drop in October 1987; other down periods occurred during the Great Financial Crisis in the fall of 2008 and Covid in March 2020. The largest three-day return is over 17% and occurs in the market rebound from Covid, with bounce backs during the Great Financial crisis also high on the list.
So while recent returns have been weak historically, they are well within typical ranges. But the past is over. What might this mean for the future? Does a bad one-day or three-day return forbode worsening returns ahead? Let’s again turn to historical data.
The second exhibit shows “box and whiskers” plots of the range of future one-year returns[2] grouped according to three-day returns. The three-day returns are broken up into ten groups or deciles; the worst 10% of three-day returns is in decile 10, the far-left plot. These worst 10% of three-day returns range from -1.96% to -25.53%. The box and whiskers plot then shows the range of subsequent one-year returns for each of the deciles. The box shows the range for the middle 50% of all subsequent returns, with the median return given by the horizontal line inside the box. The whiskers extend out from the top and bottom of the box by 1.5 times the height of the box. Outliers beyond that are shown as circles. For example, for decile 10 the middle 50% of subsequent one-year returns range between -0.40% and 28.32%, with median value of 16.48% and min and max values of -46.34% and 77.80%.
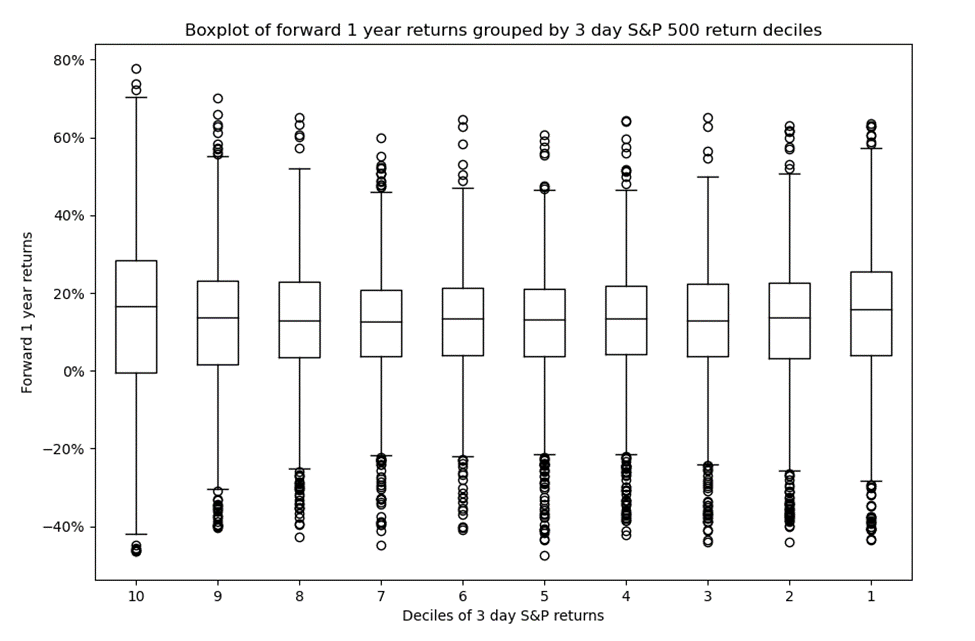
These box and whiskers plots show us a lot of things. First and foremost, the ten plots all look qualitatively similar. Whether three-day returns are weak or strong, future one-year returns display similar patterns. What are those patterns? Most of the time, the one-year returns are positive. We see this by the range of boxes almost always being positive. The median is always positive. There are outliers, with low returns somewhat worse than -40% and high returns somewhat better than 60% in each of the deciles. Decile 10 (the worst 3-day returns) has the largest variation in returns, but those trying to time the market must note that large moves can happen on both the upside and the downside. We have done the same analysis with subsequent one-month and one-week returns and again found no pattern of future results based on recent returns[3].
The main takeaway here is that whether recent returns have been weak or strong, they tell you very little about what future returns might be – positive or negative. Historically, these returns have typically been nicely positive, but there have been occasions of quite bearish markets. Investors in the stock market have received historically nice returns for bearing the risk that bad periods can occur. Because the market generally goes up no matter what the recent returns, those who are tempted to sell off after a brief downturn such as we have just seen, run the very serious risk of missing out on subsequent gains. And that is not a good recipe for investing success.
Given the unpredictability of future returns, investors are best served by having a diversified asset allocation target that considers their return needs and risk tolerance, and sticking to it, even and especially on big down days. Diversification can provide benefits such as moderating large downfalls in any single strategy. Bonds are a typical diversifier to stocks. Diversification is also possible within equities to other parts of the market that don’t necessarily move in tandem, such as taking on exposure to small caps, other factors such as value, and international stocks. Allocations to alternatives such as absolute return strategies that are uncorrelated to the market help as well. A properly diversified portfolio allows an investor to better stomach the inevitable dips of the stock market roller coaster and reap the long-term rewards it has offered.
[1] We’ve run the results on shorter periods such as the past decade, and longer periods such as back to 1927 using proxies. Results are qualitatively similar; ask if interested. The return data used here is from Datastream.
[2] In this piece we approximate one week, one month, and one year returns by 5, 22, and 252 trading days.
[3] These results are available on request.
DISCLAIMER AND DISCLOSURE
The opinions expressed here are exclusively those of Bridgeway Capital Management (“Bridgeway”). Information provided herein is educational in nature and for informational purposes only and should not be considered investment, legal, or tax advice.
Past performance is not indicative of future results.
Investing involves risk, including possible loss of principal. In addition, market turbulence and reduced liquidity in the markets may negatively affect many issuers, which could adversely affect client accounts.
Diversification neither assures a profit nor guarantees against loss in a declining market.
The S&P 500 Index is a broad-based, unmanaged measurement of changes in stock market conditions based on the average of 500 widely held common stocks.
One cannot invest directly in an index. Index returns do not reflect fees, expenses, or trading costs associated with an actively managed portfolio.