
Jacob Pozharny, PhD

Cindy Griffin, CIPM
Executive Summary
Bridgeway’s goal to be an enduring firm and to serve our clients, colleagues, and community for the long-term has led us to consider offering a number of different strategies over the years. Through the lens of relational investing, we have stayed curious and completed countless hours of research, continuously looking for the intersection of where our investment expertise lies and what strategies to offer that could best serve our clients. Through this journey, we concluded that emerging markets small-cap equity is an attractive asset class and that Bridgeway is uniquely positioned to maximize the opportunities in this asset class for the following reasons:
- Emerging markets small-cap equity has historically offered lower correlation not only to non-equity asset classes but also to other equity asset classes
- Active management has the potential to outperform in emerging markets small-cap equity
- A systematic, quantitative process is able to assess opportunities in emerging markets small-cap equity efficiently
- Relative to other equity markets, emerging markets small-cap equity currently has a more attractive value-to-quality profile
- Bridgeway’s history of closing strategies at responsible asset levels allows us to explore capacity constrained areas such as emerging markets small-cap equity without compromising the investment philosophy or process
- Bridgeway’s global research into intangibles offers a novel approach to investing in non-US markets
Comparing Emerging Markets Small-Cap Correlation
Much has been written about how the emerging markets equity asset class can be a good diversifier to non-equity asset classes. Viewing correlations for the MSCI Emerging Markets Small Cap Index versus various representative non-equity indexes shows that correlations are also low for this asset class relative to non-equity asset classes. And while some correlations have nominally crept up in recent years, the long-term correlations of the MSCI Emerging Markets Small Cap Index have remained low for longer time periods.
Correlation Relative to MSCI Emerging Markets Small Cap Index as of 3/31/2021
| Asset Class | Index Representative | 3 Year | 5 Year | 10 Year |
|---|---|---|---|---|
| US Broad Fixed Income | Bloomberg Barclays US Aggregate | 0.12 | 0.16 | 0.10 |
| US High Yield Fixed Income | Bloomberg Barclays US High Yield – Corporate | 0.82 | 0.78 | 0.79 |
| US Real Estate | MSCI US REIT INDEX – Gross Return | 0.76 | 0.60 | 0.61 |
| Commodities | S&P GSCI Total Return | 0.63 | 0.56 | 0.56 |
While the correlations of emerging markets small-cap equity relative to non-asset classes are relatively low, how do correlations for this asset class compare to other equity asset classes? We looked at rolling 36-month correlations for various MSCI indexes relative to the MSCI AC World IMI. Since the common inception in 2001 of the indexes shown, the MSCI Emerging Markets Small Cap Index has shown a persistently lower correlation relative to the MSCI AC World IMI.
Lower correlations may be attributed to larger differences in cyclical versus defensive sectors, which can – and have – driven differences in returns even within emerging markets. Comparing the sector weights of the MSCI Emerging Markets Index versus the MSCI Emerging Markets Small Cap Index shows these stark differences. In the table below, cyclical sectors (Communication Services, Consumer Discretionary, Financials, Industrials, Information Technology, and Materials) had an average weight difference of 6.49%, while defensive sectors (Consumer Staples, Energy, Health Care, Real Estate, and Utilities) had an average weight difference of 2.87%. As these differences persist, correlations may remain lower particularly during different economic regimes, which provides good diversification opportunities for emerging markets small-cap.
| Sector Weights (%) As of 3/31/2021 | MSCI Emerging Markets Index | MSCI Emerging Markets Small Cap Index | Absolute Difference |
|---|---|---|---|
| Communication Services | 11.74 | 3.67 | 8.07 |
| Consumer Discretionary | 17.65 | 12.58 | 5.07 |
| Consumer Staples | 5.63 | 5.67 | 0.04 |
| Energy | 4.83 | 2.10 | 2.73 |
| Financials | 18.24 | 10.73 | 7.51 |
| Health Care | 4.46 | 8.99 | 4.53 |
| Industrials | 4.30 | 14.95 | 10.65 |
| Information Technology | 20.92 | 17.65 | 3.27 |
| Materials | 8.08 | 12.46 | 4.38 |
| Real Estate | 2.15 | 6.88 | 4.73 |
| Utilities | 2.00 | 4.32 | 2.32 |
Another potential contributor to lower correlations within emerging markets and drivers to return is the difference in country allocations. An examination of country weights of the MSCI Emerging Markets Index versus the MSCI Emerging Markets Small Cap Index shows some stark differences.
Country Weights (%) as of 3/31/2021
| Country | MSCI Emerging Markets Index | MSCI Emerging Markets Small Cap Index |
|---|---|---|
| Argentina | 0.11 | 0.55 |
| Brazil | 4.46 | 6.05 |
| Chile | 0.57 | 0.95 |
| China | 37.91 | 10.80 |
| Colombia | 0.16 | 0.24 |
| Czech Republic | 0.10 | 0.03 |
| Egypt | 0.08 | 0.26 |
| Greece | 0.11 | 1.40 |
| Hungary | 0.21 | 0.08 |
| India | 9.65 | 16.98 |
| Indonesia | 1.22 | 1.80 |
| Korea | 13.33 | 18.00 |
| Kuwait | 0.50 | 0.73 |
| Malaysia | 1.37 | 3.06 |
| Mexico | 1.74 | 1.83 |
| Pakistan | 0.02 | 0.45 |
| Peru | 0.21 | 0.11 |
| Philippines | 0.64 | 0.73 |
| Poland | 0.63 | 1.17 |
| Qatar | 0.68 | 0.88 |
| Russia | 3.11 | 0.83 |
| Saudi Arabia | 2.77 | 2.42 |
| South Africa | 3.81 | 3.58 |
| Taiwan | 13.84 | 21.49 |
| Thailand | 1.88 | 3.66 |
| Turkey | 0.29 | 1.37 |
| United Arab Emirates | 0.58 | 0.52 |
The most significant difference between the two is the weighting to China. The MSCI Emerging Markets Index is dominated by its weight in China at 37.9% while the MSCI Emerging Markets Small Cap Index weight is more modest at 10.8%. Further differences are evident when looking at the composition of the largest and smallest country weights. The top three country weights in the MSCI Emerging Markets Index – China, Taiwan, and Korea – make up 65.1% of the total weight of the Index while the top three country weights for the MSCI Emerging Markets Small Cap Index – Taiwan, Korea, and India – make up 56.5% of the Index. On the smaller side, countries with individual weights of less than 1% in the MSCI Emerging Markets Index make up more than half of the country constituents, but less than 5% of the total weight of the Index in aggregate. In contrast, the MSCI Emerging Markets Small Cap Index has fewer than half its constituents with individual weights of less than 1%, but the aggregate weight of these constituents is larger at 6.4%. Like the differences in sectors, as these differences in country weights persist correlations may remain lower and broader diversification opportunities across countries may continue to exist for emerging markets small-cap.
Active Management in Emerging Markets Small-Cap
The argument on whether to pursue an active versus passive approach in equity strategies has been long debated with strong proponents on each side. Each side has put forth compelling considerations. However, we believe that in the case of the emerging markets small-cap, active management has an edge over passive management. Historical evidence has shown that active management in emerging markets small-cap equity tends to well outperform a common benchmark, which is not always the case for other asset classes.
In the chart above, we show the excess gross return over the long-term (10 years) of the median institutional manager in four equity universes from the eVestment database: US Large Cap Core Equity, US Small Cap Core Equity, Global Emerging Markets Equity, and Global Emerging Markets Small Cap Equity against a common benchmark for each universe and the results are striking. Over this long-term period, the median Global Emerging Markets Small Cap Equity manager outperforms the MSCI Emerging Markets Small Cap Index by more than three percent. And while the median Global Emerging Markets Equity performance against the MSCI Emerging Markets Index and the median US Small Cap Core Equity manager performance against the Russell 2000 Index are both positive, they are only modestly so and such modest performance could likely be eroded by management fees. Finally, during this same period, the median US Large Cap Core Equity manager underperforms the Russell 1000 Index. We believe this is strong evidence that persistent excess return in emerging market small-cap equity can be achieved with an active approach to management.
Quantitative Management in Emerging Markets Small-Cap
Historically, asset managers who wanted to invest in emerging markets small-cap faced some difficulty as data from these markets were viewed as not as reliable as developed markets; this was a particular challenge for those managers – traditional fundamental or quantitative – that relied on evaluation of company fundamentals as a key part of the investment process. In recent years, as emerging markets economies have opened up, better governance and more reliable data allow managers to evaluate company fundamentals more consistently. However, this does not put traditional fundamental managers and quantitative managers on the same footing when investing in emerging markets small-cap. Quantitative management in emerging markets small-cap equity has potential advantages over traditional fundamental management. Most importantly, the large number of constituents tends to favor a quantitative approach to investing. With nearly 1,700 names in the MSCI Emerging Markets Small Cap Index, even the largest traditional fundamental manager would need several analysts to cover the entire Index. Similarly, the MSCI Emerging Markets Small Cap Index covers 27 diverse countries from Argentina to the United Arab Emirates. Because a quantitative approach relies on data and can use modern programming and statistical analysis to evaluate companies, quantitative investment managers can cover these same 1,700 names in 27 countries more quickly and efficiently and with more accuracy than a traditional fundamental manager. And because a quantitative approach allows an investment manager to cover all the names in the universe, there may be more potential opportunities for a quantitative investment manager than a traditional fundamental manager may ever discover.
A quantitative investment approach can also have an advantage over a traditional fundamental approach because of the systematic nature of the typical quantitative investment process. A quantitative investment manager builds a rules-based system for managing the entire investment process from what variables to use to evaluate companies to when and what size positions to establish to when to sell. In more volatile markets like emerging markets, this can be particularly beneficial as it takes out the doubt or emotion that may set in during uncertain market environments. And systematic, quantitative managers can still uncover new research and incorporate new data into the process to ensure that the process continues to capture the returns being sought.
Is Emerging Markets Small-Cap an Attractive Asset Class Now?
The question of whether to invest in any asset class at a particular time very often hints at market timing, something we do not suggest attempting. Even the most sophisticated investors would need to get the timing right multiple times for each asset class if a market-timing approach was implemented. That said, we believe emerging markets small-cap is an excellent diversifier and can be part of an allocation designed for long-term goals.
Nevertheless, asking the question of whether emerging markets small-cap is an attractive asset class now can be informative and assist with understanding how the asset class fits into an overall asset allocation. To do this, we reviewed the year-over-year return of indexes that make up the MSCI ACWI IMI Index and plotted each return value (book yield) versus quality (return on equity) profile.
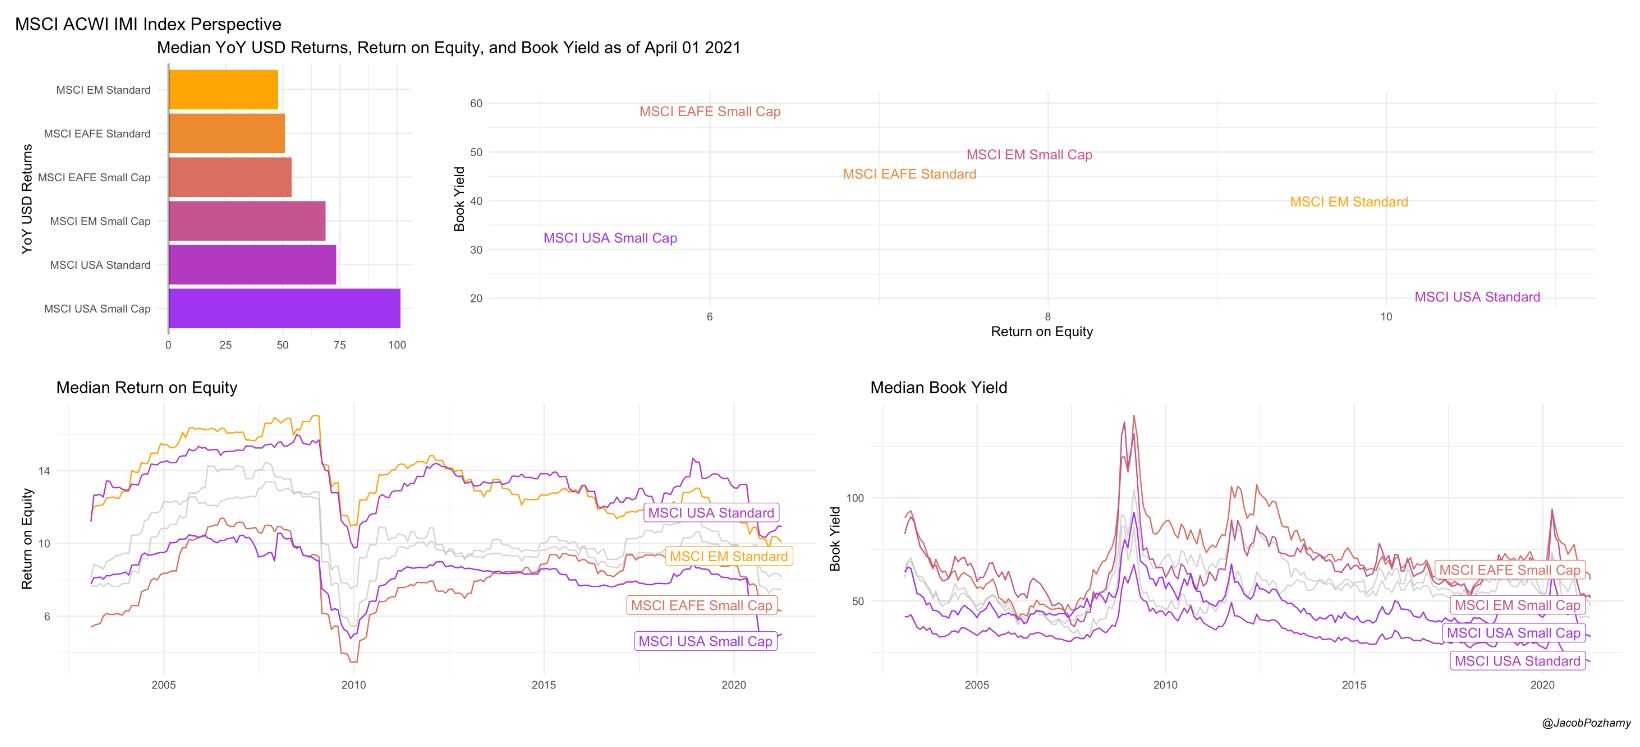
As of April 1, 2021, the MSCI Emerging Markets Small Cap Index has one of the most attractive value versus quality profiles on the chart: the book yield is the second highest among all the indexes plotted while the return on equity is the third highest. And while the Index has an attractive profile that appears relatively cheap and higher quality, the year-over-year return has not yet reflected that attractiveness with only a very slight modest positive return, indicating a possibility for further growth in the asset class.
Responsibly Managing Capacity in Emerging Markets Small-Cap
At Bridgeway, we believe in doing what is best for the long-term interests of existing investors. This means that in asset classes that are capacity constrained, we will close at responsible levels in order to maintain the integrity of the investment process for our existing investors. Bridgeway has a history of closing strategies early to protect the process and existing investors, even when it means turning down large amounts of assets. In fact, in one of our most capacity-constrained strategies, we have been closed to new investors for more than a decade.
In any capacity constrained asset class, investors should be concerned about how an investment manager manages that capacity. In emerging markets small-cap equity, investors should be even more concerned about capacity constraints as opportunities to stray from the investment process abound and liquidity can be a potential issue. Bridgeway’s experience in managing assets in capacity-constrained asset classes can help successfully guide our experience in emerging markets small-cap. Additionally, Bridgeway’s international equity team, led by our Head of International Equity, Jacob Pozharny, PhD, has more than 25 years managing non-US equity strategies, including in capacity constrained asset classes. Along with the support and expertise of the entire investment management team at Bridgeway, this creates an experience in which our investors can be confident that we have their long-term interests in mind and that our investment philosophy and approach maintain integrity.
Bridgeway in Emerging Markets Small-Cap
Expanding our investment strategies into non-US equity is a natural evolution from our US equity strategies. As a quantitative investment firm, the factors we utilize are tested not only in the US, but worldwide. And our multiple decades of experience qualifying and validating fundamental data in lowly trafficked areas of the equity markets serves to enhance our capabilities in emerging markets small-cap equity.
Most notable, though, is our innovative approach to investing in emerging markets small-cap. As with our approach to the US market, we believe that equity price changes are driven primarily by financial fundamentals over the long run. However, as companies increasingly rely on intangible assets to drive business, we have seen these intangible assets displace traditional tangible, physical assets affecting financial statements. Based on our research, we believe that categorizing companies based on their Intangible Capital Intensity (ICI) has the potential to improve stock selection by using the most relevant metrics, particularly in non-US markets.
Our framework for ICI is determined at the industry level, with high ICI industries having higher levels of intangible investment (e.g., pharmaceuticals, software, telecom services, media, etc.) while low ICI industries have lower levels of intangible investment (e.g., utilities, materials, capital goods, real estate, etc.). In applying factors to these ICI categories, we use three distinct groups: Value, Quality, and Sentiment. Our research has found:
- Value has higher factor application efficacy in low ICI companies
- Quality’s efficacy remains relatively steady for high and low ICI companies
- Sentiment has higher factor application efficacy in high ICI companies
Contextually applying factors based on ICI has the potential to shape stock selection in a way that no other previous research on intangibles has. For more on this innovative approach, read Measuring Intangible Capital Intensity: A Global Analysis by Head of International Equity, Jacob Pozharny, PhD, Head of Research, Andrew Berkin, PhD, and Research Analyst, Amitabh Dugar, PhD.
Conclusion
As Bridgeway enters this period of expansion into non-US equity strategies, our emerging markets small-cap strategy is one way to further our approach to relational investing – where we unite results for investors and returns for humanity.
With the maiden launch of our emerging markets small-cap strategy, we bring together an attractive asset class with established experience and expertise and a reputation for maintaining integrity by managing capacity responsibly. Beginning our foray into non-US equities in emerging markets small-cap equity lies squarely at the intersection of our investment expertise and how we can best serve our clients. We are confident we can offer a unique strategy in emerging markets small-cap equity with high conviction in our investment philosophy and process.
DISCLAIMERS AND DISCLOSURES
The opinions expressed here are exclusively those of Bridgeway Capital Management (“Bridgeway”). Information provided herein is educational in nature and for informational purposes only and should not be considered investment, legal, or tax advice.
Past performance is not indicative of future results.
Investing involves risk, including possible loss of principal. In addition, market turbulence and reduced liquidity in the markets may negatively affect many issuers, which could adversely affect the strategy. Value stocks as a group may be out of favor at times and underperform the overall equity market for long periods while the market concentrates on other types of stocks, such as “growth” stocks. Emerging markets are those countries that are classified by MSCI as emerging markets and generally consist of those countries with securities markets that are less sophisticated than more developed markets in terms of participation, analyst coverage, liquidity, and regulation. These are markets that have yet to reach a level of maturity associated with developed foreign stock markets, especially in terms of participation by investors. These risks are in addition to the usual risks inherent in U.S. investments. There is the possibility of expropriation, nationalization, or confiscatory taxation, taxation of income earned in foreign nations or other taxes imposed with respect to investments in foreign nations, foreign exchange control (which may include suspension of the ability to transfer currency from a given country), default in foreign government securities, political or social instability, or diplomatic developments which could affect investments in securities of issuers in those nations. The government and economies of emerging markets feature greater instability than those of more developed countries. Such investments tend to fluctuate in price more widely and to be less liquid than other foreign investments. Investments in small companies generally carry greater risk than is customarily associated with larger companies. This additional risk is attributable to a number of reasons, including the relatively limited financial resources that are typically available to small companies, and the fact that small companies often have comparatively limited product lines. In addition, the stock of small companies tends to be more volatile and less liquid than the stock of large companies, particularly in the short term and particularly in the early stages of an economic or market downturn.
Diversification neither assures a profit nor guarantees against loss in a declining market.
The Bloomberg Barclays US Aggregate Bond Index is a broad-based flagship benchmark that measures the investment grade, US dollar-denominated, fixed-rate taxable bond market. The index includes Treasuries, government-related and corporate securities, MBS (agency fixed-rate and hybrid ARM pass-throughs), ABS, and CMBS (agency and nonagency). Provided the necessary inclusion rules are met, US Aggregate-eligible securities also contribute to the multicurrency Global Aggregate Index and the US Universal Index, which includes high yield and emerging markets debt.
The Bloomberg Barclays US Corporate High Yield Bond Index measures the USD-denominated, high-yield, fixed-rate corporate bond market. Securities are classified as high yield if the middle rating of Moody’s, Fitch, and S&P is Ba1/BB+/BB+ or below. Bonds from issuers with an emerging markets country of risk, based on the indices’ EM country definition, are excluded. The US Corporate High Yield Index is a component of the US Universal and Global High Yield Indices.
The MSCI EAFE Index is an equity index that captures large and mid cap representation across 21 Developed Markets countries around the world, excluding the US and Canada. With 874 constituents, the index covers approximately 85% of the free float-adjusted market capitalization in each country.
The MSCI EAFE Small Cap Index is an equity index that captures small cap representation across Developed Markets countries around the world, excluding the US and Canada. With 2,354 constituents, the index covers approximately 14% of the free float-adjusted market capitalization in each country.
The MSCI Emerging Markets Index captures large and mid cap representation across 27 Emerging Markets (EM) countries. With 1,381 constituents, the index covers approximately 85% of the free float-adjusted market capitalization in each country.
The MSCI Emerging Markets Small Cap Index includes small cap representation across 27 Emerging Markets countries. With 1,692 constituents, the index covers approximately 14% of the free float-adjusted market capitalization in each country. The small cap segment tends to capture more local economic and sector characteristics relative to larger Emerging Markets capitalization segments.
The MSCI US REIT Index is a free float-adjusted market capitalization weighted index that is comprised of equity Real Estate Investment Trusts (REITs). The index is based on the MSCI USA Investable Market Index (IMI), its parent index, which captures the large, mid and small cap segments of the USA market. With 137 constituents, it represents about 99% of the US REIT universe and securities are classified under the Equity REITs Industry (under the Real Estate Sector) according to the Global Industry Classification Standard (GICS®), have core real estate exposure (i.e., only selected Specialized REITs are eligible) and carry REIT tax status.
The MSCI USA Index is designed to measure the performance of the large and mid cap segments of the US market. With 620 constituents, the index covers approximately 85% of the free float-adjusted market capitalization in the US.
The MSCI USA Small Cap Index is designed to measure the performance of the small cap segment of the US equity market. With 1,741 constituents, the index represents approximately 14% of the free float-adjusted market capitalization in the US.
The S&P GSCI index measures commodity market performance through futures. The S&P GSCI is weighted by world production and comprises the physical commodities that have active, liquid futures markets. There is no limit on the number of commodities that may be included in the S&P GSCI; any commodity whose contract satisfies the eligibility criteria and the other conditions specified in this methodology are included.
One cannot invest directly in an index. Index returns do not reflect fees, expenses, or trading costs associated with an actively managed portfolio.