
Andrew L. Berkin, PhD

Christine Wang, CFA, CPA
Heard enough already about value’s underperformance and why the evidence suggests staying the course? Just in case not, we will live our relational investing1 principle of stating where we stand and briefly summarize our research on value overall in the US market. More importantly, we will move from Wall Street down a different street with a focus on US small-cap value for a discussion of One of These Is Not Like the Others2.
Overall US Value
Looking at the US stock market back to 19263, it’s pretty obvious to see that One of These (Columns) Is Not Like the Others. In general, over the entire period of history, the right most column with the deepest value exposure has had distinctly higher returns than others.
US Stock Market Since 7/1926 (Annualized, %), as of 9/30/2020
| Growth | Mid-Gro | Mid | Mid-Val | Value | |
|---|---|---|---|---|---|
| Big | 9.97 | 9.54 | 10.27 | 8.65 | 10.44 |
| Med-Big | 10.38 | 10.76 | 11.61 | 12.37 | 11.62 |
| Medium | 9.21 | 12.28 | 12.22 | 13.37 | 12.66 |
| Med-Sml | 7.55 | 11.77 | 12.48 | 13.06 | 14.29 |
| Small | 2.62 | 6.67 | 11.04 | 13.86 | 15.39 |
Source: Bridgeway, Ken French data library4, total US stocks formed into 25 portfolios based on size exposure defined by market capitalization and value exposure defined by price to book ratios.
For most value investors though, the past one, five, and 10 years has proven instead that One of These (Time Periods) is Not Like the Others. Notably, the results in the most recent decade are the opposite of the results back to 1926.
US Stock Market Last 10 Years (Annualized, %), as of 9/30/2020
| Growth | Mid-Gro | Mid | Mid-Val | Value | |
|---|---|---|---|---|---|
| Big | 18.11 | 13.41 | 11.62 | 7.24 | 7.48 |
| Med-Big | 16.66 | 13.73 | 10.29 | 7.98 | 6.45 |
| Medium | 13.72 | 14.06 | 9.34 | 10.42 | 3.47 |
| Med-Sml | 14.60 | 13.03 | 9.78 | 6.76 | 6.86 |
| Small | 7.92 | 12.12 | 8.27 | 7.83 | 7.66 |
US Stock Market Last 5 yr (Annualized, %), as of 9/30/2020
| Growth | Mid-Gro | Mid | Mid-Val | Value | |
|---|---|---|---|---|---|
| Big | 21.75 | 13.31 | 9.72 | 2.70 | 4.94 |
| Med-Big | 18.48 | 12.98 | 9.17 | 0.36 | 1.80 |
| Medium | 13.21 | 11.14 | 6.57 | 7.09 | -1.52 |
| Med-Sml | 15.80 | 12.89 | 6.79 | 1.25 | 3.35 |
| Small | 12.19 | 11.60 | 7.84 | 3.49 | 4.20 |
US Stock Market 1 Year (%), as of 9/30/2020
| Growth | Mid-Gro | Mid | Mid-Val | Value | |
|---|---|---|---|---|---|
| Big | 40.83 | 13.57 | -2.01 | -20.60 | -16.12 |
| Med-Big | 33.35 | 8.53 | -4.78 | -18.65 | -26.69 |
| Medium | 22.64 | 14.73 | -12.12 | -6.20 | -26.65 |
| Med-Sml | 27.58 | 4.78 | -8.38 | -22.00 | -10.05 |
| Small | 31.49 | 30.96 | 2.44 | -15.21 | -8.49 |
Source: Bridgeway, Ken French data library4, total US stocks formed into 25 portfolios based on size exposure defined by market capitalization and value exposure defined by price to book ratios.
Based on the long-term evidence, the long and deep drawdown of value in the US is not surprising (though it’s still not fun). It has happened before with value, the overall stock market, and other factors. While challenging to endure, underperformance provides confirming evidence of exposure to different sources of risk that investors should seek. Put another way, this underperformance is a manifestation of the “risk” portion of “risk premium” that ultimately has been rewarded; the higher historical returns of value are not a free lunch and require a strong stomach.
On the positive side, historical evidence for value gives us optimism for the coming decade. In the US, value5 has outperformed growth6 91% of the time over rolling 10-year periods going back to 1926. Over those same periods, the US stock market7 has only outperformed the risk-free rate 86% of the time; thankfully, investors don’t typically question the benefits of staying the course with stocks over cash, and we believe the same holds for staying the course with value stocks.
We don’t know when value will recover, but when it does, history shows it has typically been strong. Long-term evidence for the US shows that not only has using deeper value exposure and multiple measures produced higher returns when times are good, but also has helped in drawdowns and recovery. For more on value overall, see Factoring in Bear Markets, Stress Test: How Factors Perform Before, During, and After Recessions, Value’s Defining Moment or Does Value Just Need Some Growth?, or email advisors@bridgeway.com.
A Deeper Look Into US Small Value
So, what about small-cap value in the US? As with value in the market overall, the results for small-cap value over the last decade are starkly different than long-term results back to 1926.
As the tables above and chart below shows for the period back to 1926, there has been a 2.33% annualized benefit in return for the very smallest and most value companies (15.39%) shown in the bottom row and last column of each table, compared to the next smallest and next deepest value companies (13.06%) shown in the fourth column and fourth row of each table for almost 95 years. On the other hand, for the last 10 years, the benefit was only 0.90% annualized for the additional small value exposure even after including a 13.51% advantage in the last year.
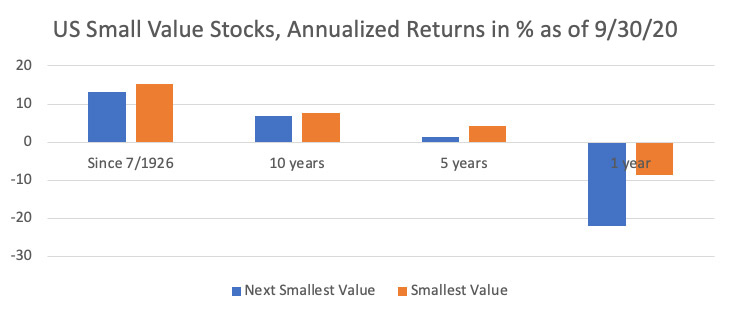
Source: Ken French data library and Bridgeway calculations. See disclosures for more information.
This concept is important to remember as we think about if One of These (Portfolios) Is Not Like the Others. The variation of returns reminds us that the level of capitalization and value exposure truly matters even among different small-cap value strategies.
When a segment of the market does well, investors should expect the portfolio with the most exposure to the factors explaining the segment’s outperformance to have the highest return. And when a segment of the market does poorly, investors should expect that same portfolio with the most exposure to the factors will underperform.
Performance across small-cap value portfolios can diverge significantly, particularly when the asset class is either doing significantly better or worse than the overall US market. This has definitely been the case over the last decade. Divergence is usually driven by meaningful differences in size of companies held, valuation of companies held, measures of value used, and differences in allocations across sectors like REITs and utilities. These performance differences rarely indicate that a portfolio is not efficiently delivering the expected returns. Instead, performance differences arise because of differences in portfolio design. A portfolio focused on the stocks with smaller size and deeper value will indeed not look like other small cap value portfolios lacking that depth of exposure.
Conclusion
So, as we sit in one of those periods that has not been like the others, what can investors do? We at Bridgeway focus on the intersection of what matters and what we can control and have discovered the power in the paradox that often the best thing for investors to do is “very little”
As leaders in relational investing, we suggest being guided by principles and staying invested in your outcome. Diversification is a crucial concept for all investors, and for Bridgeway it includes not just the way we invest but also how we run our firm and the people we hire. We do not make dramatic changes to our portfolios because we are in a pandemic, recession, bear market, or other challenging time, and we think all investors should avoid the temptation. These moves are potentially costly in terms of trading needed to implement those changes and the substantial risks of not getting that timing call exactly right.
For a PDF download of this thought piece, please use the following link:
.
1Relational investing bridges the gap between results for investors and returns for humanity with a modern approach to asset management. As a leader in relational investing, Bridgeway takes a statistical, evidence-based investment approach motivated by a passion for servant leadership and global impact which we accomplish by donating 50% of our firm profits to organizations making a positive impact for humanity. For more detail, please see http://bridgeway.com/perspectives/an-open-letter-on-relational-investing/
2If this reference is lost on you, at least one of the authors grew up on Sesame Street and fondly remembers the song “One of These Things”
3US stocks as defined by the Ken French Data library. See disclosures for more information.
4See disclosures for more information. The portfolios shown in each row and column are the intersections of 5 portfolios formed on size (market capitalization) and 5 portfolios formed on the ratio of price/book as constructed in the Ken French data library. The size breakpoints for each year are the NYSE market capitalization quintiles at the end of June of each year shown in each row of the table. Big refers to the largest quintile in terms of market capitalization, Med-Big refers to the 2nd largest, Medium refers to the 3rd largest quintile, Med-Sml refers to the 4th largest quintile, and Small refers to the smallest quintile. Price/book for June of each year is the market capitalization in December of the prior year divided by book value for the previous year’s fiscal year end. The breakpoints for each column are NYSE quintiles. Growth refers to the highest price/book quintile which have the least value exposure, Mid-Gro refers to the 2nd highest price/book quintile, Mid refers to the 3rd highest price/book quintile, Mid-Val refers to the 4th highest price/book quintile, and Value refers to the lowest quintile in terms of price/book which have the strongest value exposure.
5Using HML (high minus low) for value and growth and US stock market defined as Rm-Rf with the data and methodology from the Ken French data library. See disclosures for more information. Rm-Rf includes all New York Stock Exchange, NYSE American, and Nasdaq firms. HML for July of year t to June of t+1 includes all New York Stock Exchange, NYSE American, and Nasdaq stocks for which they have market equity data for December of t-1 and June of t, and (positive) book equity data for t-1.
6See Footnote 5
7See Footnote 5
DISCLOSURES
The opinions expressed here are exclusively those of Bridgeway Capital Management (“Bridgeway”). Information provided herein is educational in nature and for informational purposes only and should not be considered investment, legal, or tax advice.
Past performance is not indicative of future results. All returns are gross of any fees and expenses an investor would pay.
Investing involves risk, including possible loss of principal. In addition, market turbulence and reduced liquidity in the markets may negatively affect many issuers, which could adversely affect the mutual funds. Value stocks as a group may be out of favor at times and underperform the overall equity market for long periods while the market concentrates on other types of stocks, such as “growth” stocks.
Diversification neither assures a profit nor guarantees against loss in a declining market.
Data sourced from the Ken French data library uses their definitions and methodology although Bridgeway has used our preferred terminology in some cases. Price/book is Bridgeway’s preferred term which refers to the reciprocal of book equity to market equity data from the Ken French data library. US portfolios include all New York Stock Exchange, NYSE American, and Nasdaq stocks for which they have market equity data for the prior December and June, and (positive) book equity data for the prior year.