The fear and uncertainty around the coronavirus — and its impact on our families, fellow citizens, the economy, and the markets — can make it hard to find assurance in many things. One assurance that Bridgeway can offer is that our commitment to our clients, colleagues, and community is unwavering. Bridgeway’s primary expertise and service to clients is our approach to statistically driven, evidence-based investing, so the focus of this note is to share our perspective on the markets and investing during this time.
Let’s review some of what we know and don’t know at this point, and how Bridgeway is responding.
Some things we know
Sometimes, fear of risk helps us do the right thing. Sometimes it fails us miserably. Fear of the coronavirus can help us follow guidance from the CDC and other experts. Fear surrounding market downturns and turbulence can lead us astray.
The best equity investors think in decades, not days. Time is our friend.
However, markets incorporate new information with extreme efficiency. For some, it seems the markets overreact and then adjust. We see this occurring when markets decline significantly, as they have recently, and when they rise dramatically, as they did just a few months ago in December 2019. Even though down markets are hard to experience as human beings, investors can look at them as evidence that markets are processing information and uncertainty and performing as designed.
Disciplined investors who stay the course during market swings have been rewarded in the past. Based on historical evidence, we expect them to be rewarded again. Using Ken French’s data, looking at the worst 8 drawdowns since 1926 as presented in chart one below, the forward returns from trough were higher for larger drawdowns as expected, and the biggest bounce back has been in the first year. In fact, the bigger the drawdown, the more of the bounce back that happened in the first year. Thus, it is highly risky to try to time getting out of the market and then back in before the bounce back. Investors who hang on are typically rewarded, and those who sell miss out.
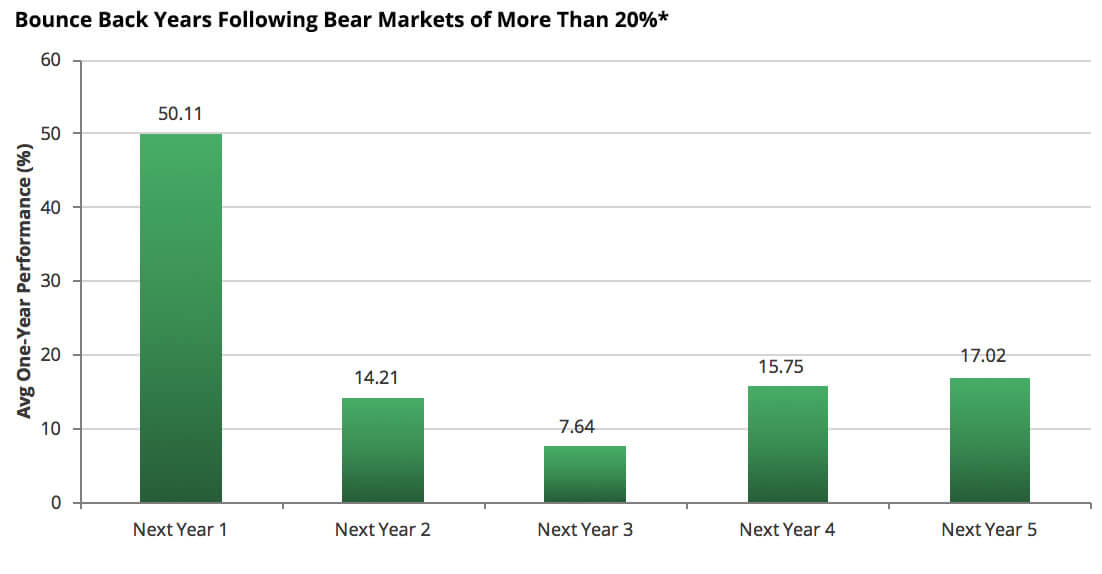
Source: Ken French monthly data, Bridgeway
*Based on the eight 20%-plus bear markets since 1926. Click here for underlying data.
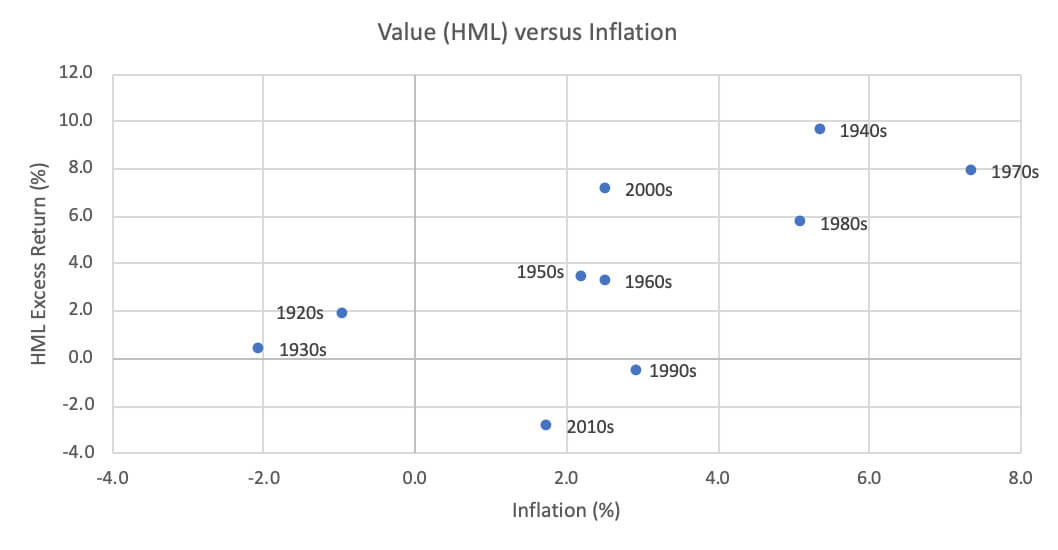
This is an especially challenging environment for value investors. Value continues to lag growth, and it has gotten worse during the recent dramatic down market. This performance gap has caused many portfolios to underperform, including Bridgeway’s, since our portfolios typically have stronger value exposure than their primary market benchmarks.
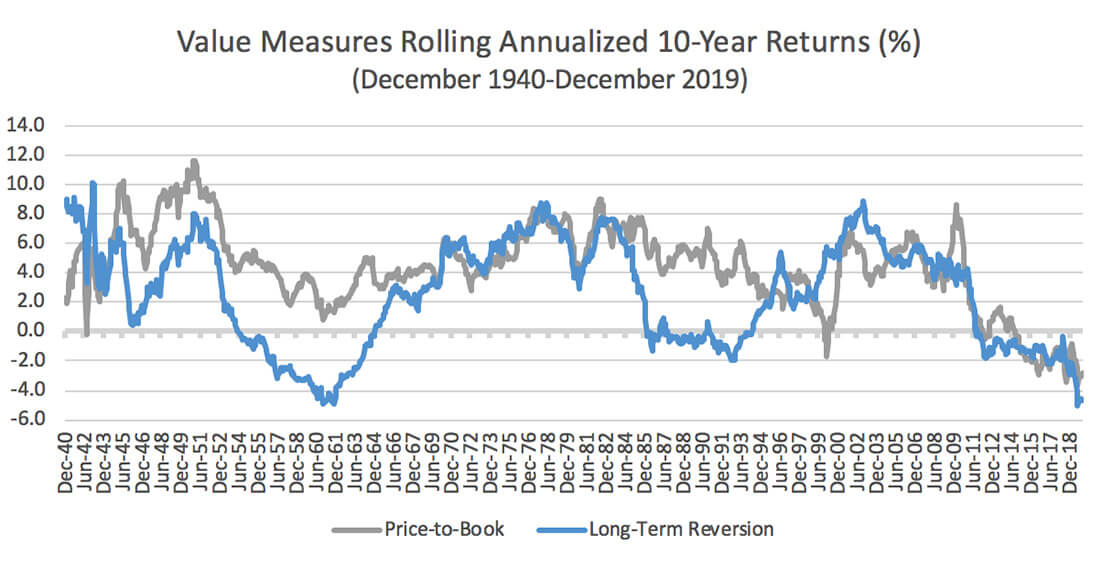
Yet this is where Bridgeway’s investment process helps a great deal, as we rely on evidence and not emotions for actions. The evidence found in historical data shows that the value premium has been remarkably pervasive and consistent. In 10-year rolling periods since 1926, the value factor outperformed 93% of the time based on Bridgeway analysis of the Ken French data library. We are currently in one of those 7% periods when value has not provided a return premium. However, history strongly suggests that these periods don’t last and that they eventually turn around.
Historical data also tells us about the magnitude of value’s previous bounce backs. The value factor as measured by the Russell 1000 value and growth universes is currently in the cheapest 10% of its history, going back 40 years to 1980. After prior periods of such extreme cheapness, the Russell 1000 Value Index outperformed the Russell 1000 Growth Index by an average of roughly five percentage points per year over the next 5 and 10 years. By carefully rebalancing portfolios to maintain value exposure, investors can be poised to ride the tailwind we expect to see when value returns to favor. We are certainly rebalancing to maintain our targeted value exposure in Bridgeway portfolios.
History does not repeat itself, but it rhymes, as Bridgeway’s Head of Research, Dr. Andrew Berkin likes to say.1 Our investment and risk professionals have been working together for more than a decade on average, and we have first-hand experience through past health and market crises such as Ebola in 2014, SARS in 2003, the post-tech bubble bear market of 2000-2003, and the recession of 2008-09. Our analysis of decades of data and academic evidence, plus our experience, tells us that investors are rewarded for taking risk and managing their behavior.
People have an amazing capacity to innovate and perform at extraordinary levels in some of the most difficult circumstances. These people drive families, companies, communities, and entire nations to outperform expectations in times like this. We believe they will again.
Some things we don’t know
Of course, we can’t predict exactly when a market turning point will come. We believe that trying to time the market or even a factor is an expensive and fruitless exercise.
We don’t know how long value will continue to underperform, but we do expect it to change.
We don’t know for sure which individuals will have the opportunity, the will, and the fortitude to rise to the occasion in this environment. In turn, we don’t know which companies will get rewarded for their innovation and extra effort in the coming weeks, months, and years. But we expect many to do so, and we expect to be among them at Bridgeway.
What we are doing
Bridgeway remains fully operational with a resilient, team-managed approach to every client portfolio. We have been working diligently to understand how the pandemic and the challenging market environment might affect our clients, colleagues, and community. More details on that work are available here.
When facing risk, we try to focus only on what we can do that would help. In the film Bridge of Spies, Tom Hanks plays an American lawyer representing a Russian spy, and he asks his client essentially the same question three different times throughout the course of the movie:
Hanks: You don’t seem alarmed.
Spy: Would it help?
Hanks: Do you never worry?
Spy: Would it help?
Hanks: So, you’re not worried?
Spy: Would it help?
The advantage of casting aside unproductive worry over things we can’t control is that we can infuse our lives with more joy and focus on more productive things—like strong relationships, rebalancing portfolios, and building a strong immune system.
We also will keep listening and learning. We’re committed to supporting the critical role that financial advisors and institutional consultants play in helping our mutual clients develop and stick with long-term plans to meet their goals—even in unprecedented times such as these.
Finally, in turbulent markets that command our attention and focus as stewards of assets, we also remain engaged with partners in our local and global community who need our support. To step up further, Bridgeway has made donations to the CDC Foundation to help with global efforts to combat the coronavirus and the Houston Food Bank to help mitigate the negative repercussions locally. We are soliciting more ideas from our team, and we welcome yours as well. As always, Bridgeway’s vision and mission keeps us focused and steadfast as we find new and creative ways of partnering to create an extraordinary future for our clients, community, and world.
1 Dr. Berkin quotes Mark Twain, but there is some controversy on this point.
DISCLAIMER
The opinions expressed here are exclusively those of Bridgeway Capital Management (“Bridgeway”). Information provided herein is educational in nature and for informational purposes only and should not be considered investment, legal, or tax advice.
The Russell 1000 Growth Index measures the performance of the large-cap growth segment of the U.S. equity universe. It includes those Russell 1000 companies with higher price-to-book ratios and higher forecasted growth values. The Russell 1000 Growth Index is constructed to provide a comprehensive and unbiased barometer for the large-cap growth segment. The Index is completely reconstituted annually to ensure new and growing equities are included and that the represented companies continue to reflect growth characteristics.
The Russell 1000 Value Index measures the performance of the large-cap value segment of the U.S. equity universe. It includes those Russell 1000 companies with lower price-to-book ratios and lower expected growth values. The Russell 1000 Value Index is constructed to provide a comprehensive and unbiased barometer for the large-cap value segment. The Index is completely reconstituted annually to ensure new and growing equities are included and that the represented companies continue to reflect value characteristics. It is not possible to invest directly in an index.
Underlying data for chart: Bounce Back Years Following the Eight 20%-plus Bear Market Declines from 1926 through 12/31/2019 of More Than 20%
| Date |
Downdraft |
Next 1Y |
Year 2 |
Year 3 |
Year 4 |
Year 5 |
| 06/1932 |
-83.71 |
157.49 |
-4.39 |
9.45 |
45.78 |
10.83 |
| 05/1947 |
-24.23 |
23.31 |
-10.95 |
41.28 |
23.43 |
13.77 |
| 06/1962 |
-23.04 |
30.27 |
19.32 |
6.6 |
6.66 |
14.02 |
| 06/1970 |
-33.59 |
44.45 |
11.22 |
-7.82 |
-15.55 |
19.04 |
| 09/1974 |
-46.42 |
39.55 |
30.85 |
0.23 |
17.36 |
13.85 |
| 11/1987 |
-29.91 |
23.76 |
29.32 |
-7.31 |
24.9 |
19.87 |
| 09/2002 |
-45.09 |
26.75 |
14.21 |
14.31 |
10.02 |
16.85 |
| 02/2009 |
-50.39 |
55.26 |
24.12 |
4.38 |
13.39 |
27.89 |
| Average |
-42.05 |
50.11 |
14.21 |
7.64 |
15.75 |
17.02 |
Source: Ken French monthly data, Bridgeway
Investing involves risk, including possible loss of principal.