As a firm that practices relational investing, we stay curious about what we see in the market, how that translates to our investment strategies and are committed to stating where we stand. The first quarter landscape for US small-cap value stocks presents a wonderful case study to share.
After a dramatic four-plus years of underperformance, small-cap value stocks came roaring back over the last year through March 31, 2021. Is this “run” of small-value stocks over, or is there more to go? Bridgeway’s analysis indicates that the size factor (less so the value factor) has indeed made up tremendous ground over the last year. However, based on our analysis of relative book-to-market valuations through the end of March, prices of small-value stocks would have to rise another 43% relative to the broader US market to get back to median historical levels.[1] At Bridgeway, we don’t believe in timing the market, but we do believe in establishing and holding appropriate factor exposures as a long-term investing best practice. After the tremendous run of large and growth stocks over the last decade, we believe small-value stocks still have room to run, and investors whose portfolios have become underweight to this segment of the market should add to their allocation.
What a Difference a Year Makes
Anyone investing in small-value stocks over the last handful of years has felt the full brunt of two factors dramatically out of favor at the same time. The Russell 2000 Value Index lagged the S&P 500 Index of large US companies by roughly double digits four years in a row from 2017 through 2020. In 2020 alone, large-cap stocks trounced small-cap value stocks by more than 33%.[2] FANMAG stocks were all the rage[3]. In this environment, not surprisingly, we have seen articles calling out the death of value and examining the question of whether size ever really was a factor.[4] Our favorite title was “Waiting for Godot.”[5]
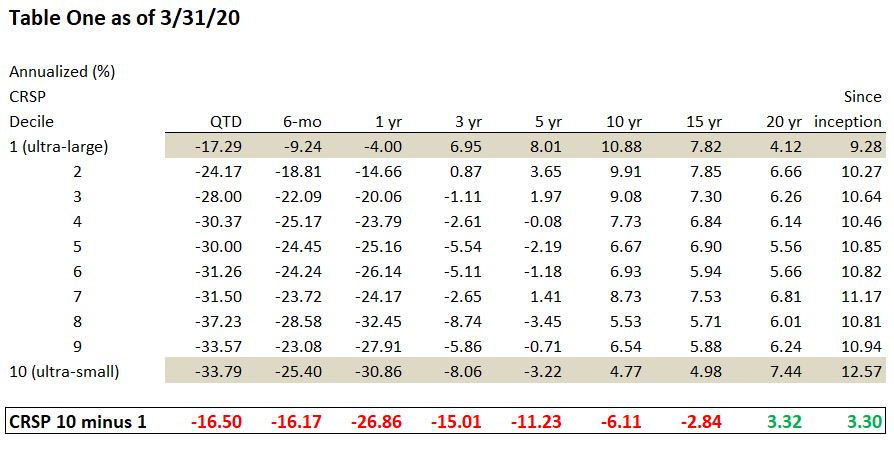
But what a difference a year makes. First, let’s look at size. Table One below shows the performance of stocks as measured by deciles of size in the Center for Research in Securities Prices (CRSP) database as of March 31, 2020. The smallest companies (“CRSP 10”) lagged the largest companies (“CRSP 1”) in every category except the twenty-year and since-1926 periods.
Source: CRSP
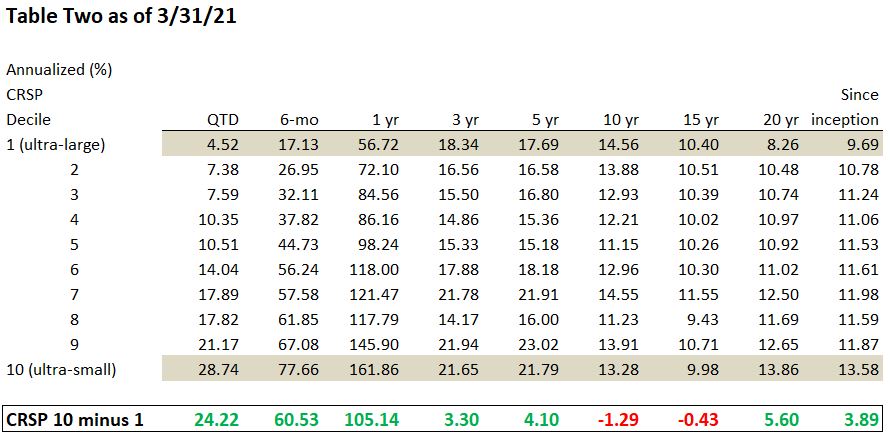
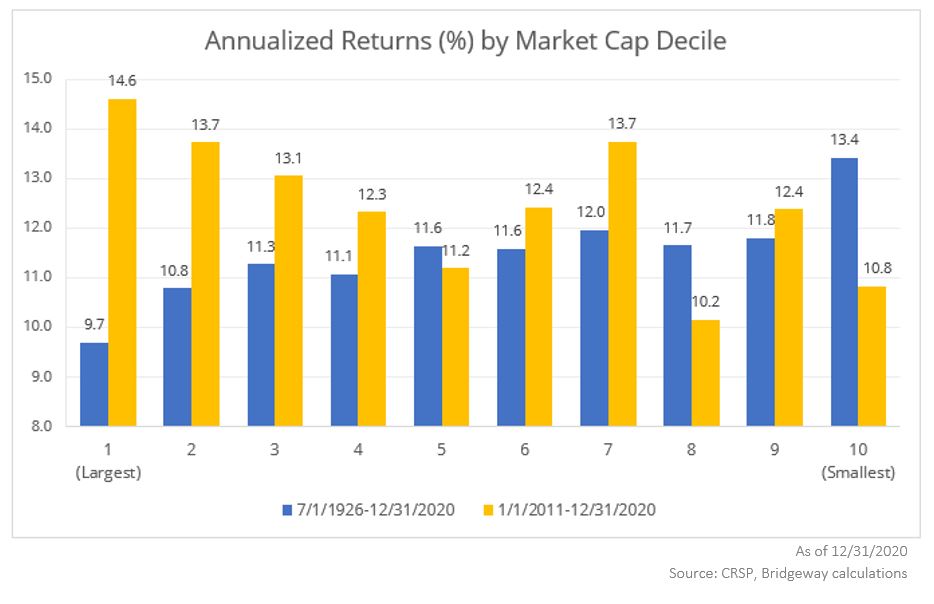
Table Two shows the same chart, but a year later. Including a very strong first quarter to start 2021, the small size factor has come roaring back. During this period, many of the top-performing funds and ETFs (Exchange Traded Funds) had “small-cap” in the name. No wonder why: looking at the full spectrum of companies by size in the Center for Research in Securities Prices database, we find the smallest companies (“CRSP 10”) made up tremendous ground. For example, at the end of Q1 2020, the smallest decile of stocks lagged the largest by over –15% annually for the past three years. Yet just one year later, those smallest stocks have now outperformed their larger peers by over 3% annually for the trailing three years. With this dramatic recovery of size, it’s fair to ask, “Is there any room to run?”
Source: CRSP
Despite the strong recent returns, note that the long-term, 10- and 15-year results are still negative as of the end of Q1 2021. The decade of underperformance suffered by small stocks has not yet fully recovered. Furthermore, one criterion that we use to judge a factor like size is that it be persistent, working across long periods of time.[6] This doesn’t mean that it should always work, as all factors go through periods where they lag. But after such weak periods, we should expect stronger performance so that returns provide the long-term expected premium. Having lagged by almost 1.3% over the last 10 years, small stocks would need to notably outperform large to get back to the historic premium seen since the inception of CRSP. There is indeed room to run. We’ll now turn to valuations to get an idea of how much.
Using the standard academic definition of valuation, “book-to-market,” we can examine both just how far out of favor small-value stocks became before March 2020 and how much they have come back.
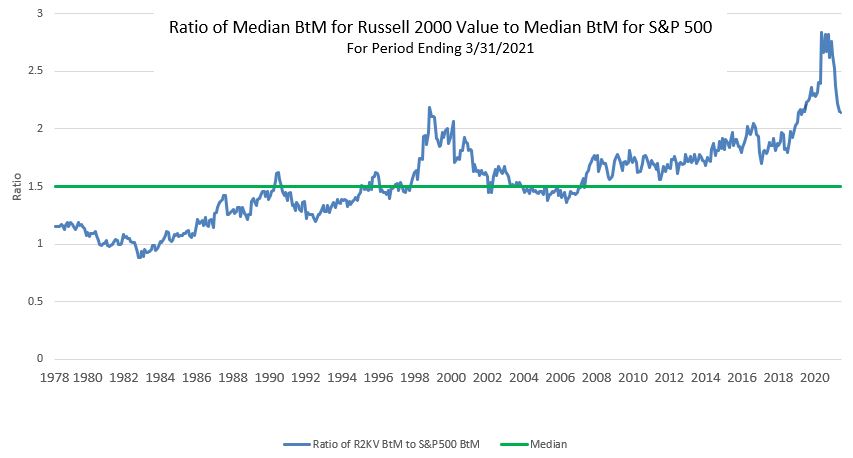
The chart below shows the ratio of median book-to-market (BtM) for the Russell 2000 Value Index to median BtM for the S&P 500. The solid green line shows the median ratio for the entire history of the Russell 2000 Value, from 1978- Mar 2021. Ratios above this line signal that small-cap value stocks are cheaper than their historical average.
Source: Compustat, Bridgeway calculations
Indeed, the peak of small-value underperformance (low valuation) was at its worst (highest in the graph) in March 2020. While the graph shows a tremendous turnaround over the following 12 months, the recent relative valuation level on March 31, 2021, was still near the level of previous peaks since 1978. It’s also of note how quickly the turnaround occurred, concentrated primarily in the last six months.
So, where do we go from here? Holding book value constant and varying only the relative prices of small-value stocks, prices would have to rise 43% from their March 31, 2021 levels to return to the historical median ratio. In other words, we’ve still got quite a bit of open field in front of us, or “room to run ” relative to the S&P 500.
Does that mean we know the timing or can guarantee 2021 will continue to be a small-value-dominated year? No, we don’t, and we can’t (see below). We do believe that factors tend over time to revert to long-term historical levels. If this happened all in one year, it would mean a 43% tailwind in performance for small-cap value as measured by the Russell 2000 Value Index relative to the S&P 500 Index. If it happened over a five-year period, that would mean a 7.4% per year (compounded) tailwind. Over a ten-year period, a 3.6% per year tailwind. We believe these are very big numbers.
Is This a Timing Factor?
No. We don’t believe in timing the market at Bridgeway, though we do believe in managing risk. Note that the recent peak of relative valuation exceeded the prior peaks, and it can happen again. As John’s Harvard Business School professor used to say, “The problem is, a very cheap investment can always get cheaper.” But it’s also true that the pullback to historical factor norms is very strong. In this case, economic and market environment factors that might cause a further comeback of small and value factors include:
A realization by investors of just how out of favor these factors became and still are
A market correction, which sometimes has investors flock to cheaper market niches, as happened with small-value stocks in the bear market of 2000-2002
A growth economy, which paradoxically helps value stocks, resulting from the pandemic recovery underway, the economic stimulus approved by Congress in March, and/or a $2 trillion infrastructure investment package introduced by President Biden in his April 28 “100 days” speech
An increase in interest rates from current very low levels, which favors value stocks over growth stocks
Nevertheless, Bridgeway doesn’t believe in timing the market. Rather, we believe in establishing a long-term plan with specific factor exposures, sticking with the plan through thick and thin, and especially when it feels least comfortable to do so. We believe small-value stocks have an appropriate role in portfolios with a long-term investment horizon and that many investors, especially those who have not rebalanced back to appropriate target levels or who have followed the “investor herd” into attractive but overpriced large-growth stocks, are underexposed to small-value stocks today.
For a PDF download of this thought piece, please use the following link:
[1] Small-value stocks and broader US market as represented by the Russell 2000 Value Index and S&P 500 Index, respectively
[2] In 2020, the Russell 1000 Growth index returned +38.49%, compared to the Russell 2000 Value Index returned +4.63%
[3] FANMAG stocks are Facebook, Apple, Netflix, Microsoft, Amazon, and Google
[4] See, for example, Fact, Fiction, and the Size Effect by Ron Alquist, Ronen Israel, and Tobias Moskowitz, Journal of Portfolio Management, Fall 2018; There Is No Size Effect: Daily Edition, Cliff Asness, AQR, September 18, 2020; and Settling the Size Matter, by David Blitz and Mattias Hanauer, Journal of Portfolio Management Quantitative Special Issue 2021
The opinions expressed here are exclusively those of Bridgeway Capital Management (“Bridgeway”). Information provided herein is educational in nature and for informational purposes only and should not be considered investment, legal, or tax advice.
Past performance is not indicative of future results.
Investing involves risk, including possible loss of principal. In addition, market turbulence and reduced liquidity in the markets may negatively affect many issuers, which could adversely affect client accounts. Value stocks as a group may be out of favor at times and underperform the overall equity market for long periods while the market concentrates on other types of stocks, such as “growth” stocks.
Diversification neither assures a profit nor guarantees against loss in a declining market.
The S&P 500 Index is a broad-based, unmanaged measurement of changes in stock market conditions based on the average of 500 widely held common stocks.
The Russell 2000 Index is an unmanaged, market value-weighted index, which measures the performance of the 2,000 companies that are between the 1,000th and 3,000th largest in the market. The Russell 2000 Value Index measures the performance of those Russell 2000 companies with lower price-to-book ratios and lower forecasted growth values. The Russell 2000 Growth Index measures the performance of those Russell 2000 companies with higher price-to-book ratios and higher forecasted growth values with dividends reinvested.
The Center for Research in Security Prices (“CRSP”) US Stock Databases contain daily and monthly market and corporate action data for over 32,000 active and inactive securities with primary listings on the NYSE, NYSE American, NASDAQ, NYSE Arca, and Bats exchanges and include CRSP broad market indexes. CRSP databases are characterized by their comprehensive corporate action information and highly accurate total return calculations.
One cannot invest directly in an index. Index returns do not reflect fees, expenses, or trading costs associated with an actively managed portfolio.
Bridgeway’s goal to be an enduring firm and to serve our clients, colleagues, and community for the long-term has led us to consider offering a number of different strategies over the years. Through the lens of relational investing, we have stayed curious and completed countless hours of research, continuously looking for the intersection of where our investment expertise lies and what strategies to offer that could best serve our clients. Through this journey, we concluded that emerging markets small-cap equity is an attractive asset class and that Bridgeway is uniquely positioned to maximize the opportunities in this asset class for the following reasons:
Emerging markets small-cap equity has historically offered lower correlation not only to non-equity asset classes but also to other equity asset classes
Active management has the potential to outperform in emerging markets small-cap equity
A systematic, quantitative process is able to assess opportunities in emerging markets small-cap equity efficiently
Relative to other equity markets, emerging markets small-cap equity currently has a more attractive value-to-quality profile
Bridgeway’s history of closing strategies at responsible asset levels allows us to explore capacity constrained areas such as emerging markets small-cap equity without compromising the investment philosophy or process
Bridgeway’s global research into intangibles offers a novel approach to investing in non-US markets
Comparing Emerging Markets Small-Cap Correlation
Much has been written about how the emerging markets equity asset class can be a good diversifier to non-equity asset classes. Viewing correlations for the MSCI Emerging Markets Small Cap Index versus various representative non-equity indexes shows that correlations are also low for this asset class relative to non-equity asset classes. And while some correlations have nominally crept up in recent years, the long-term correlations of the MSCI Emerging Markets Small Cap Index have remained low for longer time periods.
Correlation Relative to MSCI Emerging Markets Small Cap Index as of 3/31/2021
Asset Class
Index Representative
3 Year
5 Year
10 Year
US Broad Fixed Income
Bloomberg Barclays US Aggregate
0.12
0.16
0.10
US High Yield Fixed Income
Bloomberg Barclays US High Yield – Corporate
0.82
0.78
0.79
US Real Estate
MSCI US REIT INDEX – Gross Return
0.76
0.60
0.61
Commodities
S&P GSCI Total Return
0.63
0.56
0.56
Source: FactSet
While the correlations of emerging markets small-cap equity relative to non-asset classes are relatively low, how do correlations for this asset class compare to other equity asset classes? We looked at rolling 36-month correlations for various MSCI indexes relative to the MSCI AC World IMI. Since the common inception in 2001 of the indexes shown, the MSCI Emerging Markets Small Cap Index has shown a persistently lower correlation relative to the MSCI AC World IMI.
Source: FactSet
Lower correlations may be attributed to larger differences in cyclical versus defensive sectors, which can – and have – driven differences in returns even within emerging markets. Comparing the sector weights of the MSCI Emerging Markets Index versus the MSCI Emerging Markets Small Cap Index shows these stark differences. In the table below, cyclical sectors (Communication Services, Consumer Discretionary, Financials, Industrials, Information Technology, and Materials) had an average weight difference of 6.49%, while defensive sectors (Consumer Staples, Energy, Health Care, Real Estate, and Utilities) had an average weight difference of 2.87%. As these differences persist, correlations may remain lower particularly during different economic regimes, which provides good diversification opportunities for emerging markets small-cap.
Sector Weights (%) As of 3/31/2021
MSCI Emerging Markets Index
MSCI Emerging Markets Small Cap Index
Absolute Difference
Communication Services
11.74
3.67
8.07
Consumer Discretionary
17.65
12.58
5.07
Consumer Staples
5.63
5.67
0.04
Energy
4.83
2.10
2.73
Financials
18.24
10.73
7.51
Health Care
4.46
8.99
4.53
Industrials
4.30
14.95
10.65
Information Technology
20.92
17.65
3.27
Materials
8.08
12.46
4.38
Real Estate
2.15
6.88
4.73
Utilities
2.00
4.32
2.32
Source: FactSet
Another potential contributor to lower correlations within emerging markets and drivers to return is the difference in country allocations. An examination of country weights of the MSCI Emerging Markets Index versus the MSCI Emerging Markets Small Cap Index shows some stark differences.
Country Weights (%) as of 3/31/2021
Country
MSCI Emerging Markets Index
MSCI Emerging Markets Small Cap Index
Argentina
0.11
0.55
Brazil
4.46
6.05
Chile
0.57
0.95
China
37.91
10.80
Colombia
0.16
0.24
Czech Republic
0.10
0.03
Egypt
0.08
0.26
Greece
0.11
1.40
Hungary
0.21
0.08
India
9.65
16.98
Indonesia
1.22
1.80
Korea
13.33
18.00
Kuwait
0.50
0.73
Malaysia
1.37
3.06
Mexico
1.74
1.83
Pakistan
0.02
0.45
Peru
0.21
0.11
Philippines
0.64
0.73
Poland
0.63
1.17
Qatar
0.68
0.88
Russia
3.11
0.83
Saudi Arabia
2.77
2.42
South Africa
3.81
3.58
Taiwan
13.84
21.49
Thailand
1.88
3.66
Turkey
0.29
1.37
United Arab Emirates
0.58
0.52
Source: FactSet
The most significant difference between the two is the weighting to China. The MSCI Emerging Markets Index is dominated by its weight in China at 37.9% while the MSCI Emerging Markets Small Cap Index weight is more modest at 10.8%. Further differences are evident when looking at the composition of the largest and smallest country weights. The top three country weights in the MSCI Emerging Markets Index – China, Taiwan, and Korea – make up 65.1% of the total weight of the Index while the top three country weights for the MSCI Emerging Markets Small Cap Index – Taiwan, Korea, and India – make up 56.5% of the Index. On the smaller side, countries with individual weights of less than 1% in the MSCI Emerging Markets Index make up more than half of the country constituents, but less than 5% of the total weight of the Index in aggregate. In contrast, the MSCI Emerging Markets Small Cap Index has fewer than half its constituents with individual weights of less than 1%, but the aggregate weight of these constituents is larger at 6.4%. Like the differences in sectors, as these differences in country weights persist correlations may remain lower and broader diversification opportunities across countries may continue to exist for emerging markets small-cap.
Active Management in Emerging Markets Small-Cap
The argument on whether to pursue an active versus passive approach in equity strategies has been long debated with strong proponents on each side. Each side has put forth compelling considerations. However, we believe that in the case of the emerging markets small-cap, active management has an edge over passive management. Historical evidence has shown that active management in emerging markets small-cap equity tends to well outperform a common benchmark, which is not always the case for other asset classes.
Source: eVestment; the eVestment universe median calculation is using the default reporting method and default vehicle for all universe constituents to determine the median for each universe.
In the chart above, we show the excess gross return over the long-term (10 years) of the median institutional manager in four equity universes from the eVestment database: US Large Cap Core Equity, US Small Cap Core Equity, Global Emerging Markets Equity, and Global Emerging Markets Small Cap Equity against a common benchmark for each universe and the results are striking. Over this long-term period, the median Global Emerging Markets Small Cap Equity manager outperforms the MSCI Emerging Markets Small Cap Index by more than three percent. And while the median Global Emerging Markets Equity performance against the MSCI Emerging Markets Index and the median US Small Cap Core Equity manager performance against the Russell 2000 Index are both positive, they are only modestly so and such modest performance could likely be eroded by management fees. Finally, during this same period, the median US Large Cap Core Equity manager underperforms the Russell 1000 Index. We believe this is strong evidence that persistent excess return in emerging market small-cap equity can be achieved with an active approach to management.
Quantitative Management in Emerging Markets Small-Cap
Historically, asset managers who wanted to invest in emerging markets small-cap faced some difficulty as data from these markets were viewed as not as reliable as developed markets; this was a particular challenge for those managers – traditional fundamental or quantitative – that relied on evaluation of company fundamentals as a key part of the investment process. In recent years, as emerging markets economies have opened up, better governance and more reliable data allow managers to evaluate company fundamentals more consistently. However, this does not put traditional fundamental managers and quantitative managers on the same footing when investing in emerging markets small-cap. Quantitative management in emerging markets small-cap equity has potential advantages over traditional fundamental management. Most importantly, the large number of constituents tends to favor a quantitative approach to investing. With nearly 1,700 names in the MSCI Emerging Markets Small Cap Index, even the largest traditional fundamental manager would need several analysts to cover the entire Index. Similarly, the MSCI Emerging Markets Small Cap Index covers 27 diverse countries from Argentina to the United Arab Emirates. Because a quantitative approach relies on data and can use modern programming and statistical analysis to evaluate companies, quantitative investment managers can cover these same 1,700 names in 27 countries more quickly and efficiently and with more accuracy than a traditional fundamental manager. And because a quantitative approach allows an investment manager to cover all the names in the universe, there may be more potential opportunities for a quantitative investment manager than a traditional fundamental manager may ever discover.
A quantitative investment approach can also have an advantage over a traditional fundamental approach because of the systematic nature of the typical quantitative investment process. A quantitative investment manager builds a rules-based system for managing the entire investment process from what variables to use to evaluate companies to when and what size positions to establish to when to sell. In more volatile markets like emerging markets, this can be particularly beneficial as it takes out the doubt or emotion that may set in during uncertain market environments. And systematic, quantitative managers can still uncover new research and incorporate new data into the process to ensure that the process continues to capture the returns being sought.
Is Emerging Markets Small-Cap an Attractive Asset Class Now?
The question of whether to invest in any asset class at a particular time very often hints at market timing, something we do not suggest attempting. Even the most sophisticated investors would need to get the timing right multiple times for each asset class if a market-timing approach was implemented. That said, we believe emerging markets small-cap is an excellent diversifier and can be part of an allocation designed for long-term goals.
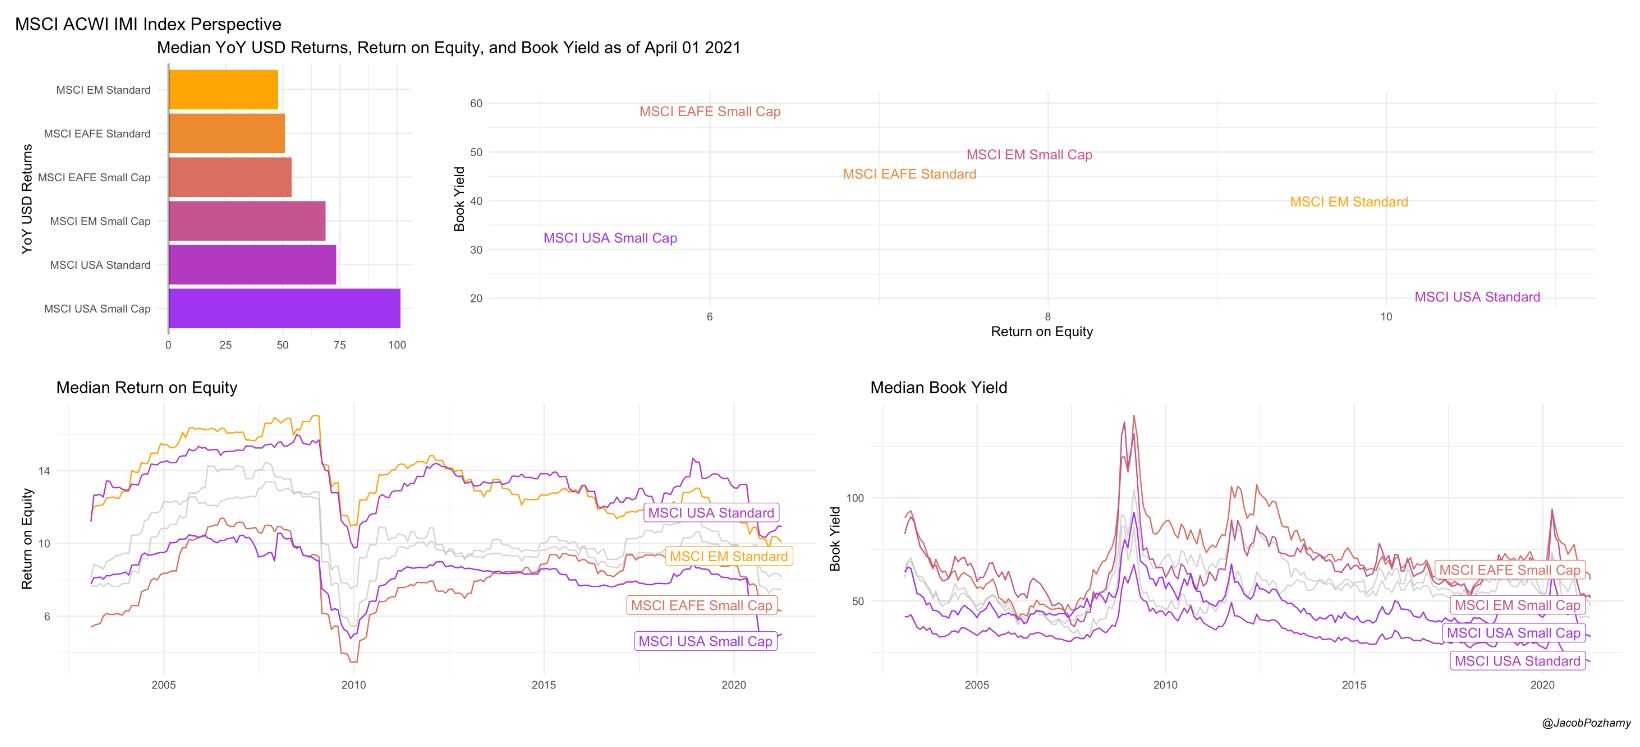
Nevertheless, asking the question of whether emerging markets small-cap is an attractive asset class now can be informative and assist with understanding how the asset class fits into an overall asset allocation. To do this, we reviewed the year-over-year return of indexes that make up the MSCI ACWI IMI Index and plotted each return value (book yield) versus quality (return on equity) profile.
Source: FactSet
As of April 1, 2021, the MSCI Emerging Markets Small Cap Index has one of the most attractive value versus quality profiles on the chart: the book yield is the second highest among all the indexes plotted while the return on equity is the third highest. And while the Index has an attractive profile that appears relatively cheap and higher quality, the year-over-year return has not yet reflected that attractiveness with only a very slight modest positive return, indicating a possibility for further growth in the asset class.
Responsibly Managing Capacity in Emerging Markets Small-Cap
At Bridgeway, we believe in doing what is best for the long-term interests of existing investors. This means that in asset classes that are capacity constrained, we will close at responsible levels in order to maintain the integrity of the investment process for our existing investors. Bridgeway has a history of closing strategies early to protect the process and existing investors, even when it means turning down large amounts of assets. In fact, in one of our most capacity-constrained strategies, we have been closed to new investors for more than a decade.
In any capacity constrained asset class, investors should be concerned about how an investment manager manages that capacity. In emerging markets small-cap equity, investors should be even more concerned about capacity constraints as opportunities to stray from the investment process abound and liquidity can be a potential issue. Bridgeway’s experience in managing assets in capacity-constrained asset classes can help successfully guide our experience in emerging markets small-cap. Additionally, Bridgeway’s international equity team, led by our Head of International Equity, Jacob Pozharny, PhD, has more than 25 years managing non-US equity strategies, including in capacity constrained asset classes. Along with the support and expertise of the entire investment management team at Bridgeway, this creates an experience in which our investors can be confident that we have their long-term interests in mind and that our investment philosophy and approach maintain integrity.
Bridgeway in Emerging Markets Small-Cap
Expanding our investment strategies into non-US equity is a natural evolution from our US equity strategies. As a quantitative investment firm, the factors we utilize are tested not only in the US, but worldwide. And our multiple decades of experience qualifying and validating fundamental data in lowly trafficked areas of the equity markets serves to enhance our capabilities in emerging markets small-cap equity.
Most notable, though, is our innovative approach to investing in emerging markets small-cap. As with our approach to the US market, we believe that equity price changes are driven primarily by financial fundamentals over the long run. However, as companies increasingly rely on intangible assets to drive business, we have seen these intangible assets displace traditional tangible, physical assets affecting financial statements. Based on our research, we believe that categorizing companies based on their Intangible Capital Intensity (ICI) has the potential to improve stock selection by using the most relevant metrics, particularly in non-US markets.
Our framework for ICI is determined at the industry level, with high ICI industries having higher levels of intangible investment (e.g., pharmaceuticals, software, telecom services, media, etc.) while low ICI industries have lower levels of intangible investment (e.g., utilities, materials, capital goods, real estate, etc.). In applying factors to these ICI categories, we use three distinct groups: Value, Quality, and Sentiment. Our research has found:
Value has higher factor application efficacy in low ICI companies
Quality’s efficacy remains relatively steady for high and low ICI companies
Sentiment has higher factor application efficacy in high ICI companies
Contextually applying factors based on ICI has the potential to shape stock selection in a way that no other previous research on intangibles has. For more on this innovative approach, read Measuring Intangible Capital Intensity: A Global Analysis by Head of International Equity, Jacob Pozharny, PhD, Head of Research, Andrew Berkin, PhD, and Research Analyst, Amitabh Dugar, PhD.
Conclusion
As Bridgeway enters this period of expansion into non-US equity strategies, our emerging markets small-cap strategy is one way to further our approach to relational investing – where we unite results for investors and returns for humanity.
With the maiden launch of our emerging markets small-cap strategy, we bring together an attractive asset class with established experience and expertise and a reputation for maintaining integrity by managing capacity responsibly. Beginning our foray into non-US equities in emerging markets small-cap equity lies squarely at the intersection of our investment expertise and how we can best serve our clients. We are confident we can offer a unique strategy in emerging markets small-cap equity with high conviction in our investment philosophy and process.
DISCLAIMERS AND DISCLOSURES
The opinions expressed here are exclusively those of Bridgeway Capital Management (“Bridgeway”). Information provided herein is educational in nature and for informational purposes only and should not be considered investment, legal, or tax advice.
Past performance is not indicative of future results.
Investing involves risk, including possible loss of principal. In addition, market turbulence and reduced liquidity in the markets may negatively affect many issuers, which could adversely affect the strategy. Value stocks as a group may be out of favor at times and underperform the overall equity market for long periods while the market concentrates on other types of stocks, such as “growth” stocks. Emerging markets are those countries that are classified by MSCI as emerging markets and generally consist of those countries with securities markets that are less sophisticated than more developed markets in terms of participation, analyst coverage, liquidity, and regulation. These are markets that have yet to reach a level of maturity associated with developed foreign stock markets, especially in terms of participation by investors. These risks are in addition to the usual risks inherent in U.S. investments. There is the possibility of expropriation, nationalization, or confiscatory taxation, taxation of income earned in foreign nations or other taxes imposed with respect to investments in foreign nations, foreign exchange control (which may include suspension of the ability to transfer currency from a given country), default in foreign government securities, political or social instability, or diplomatic developments which could affect investments in securities of issuers in those nations. The government and economies of emerging markets feature greater instability than those of more developed countries. Such investments tend to fluctuate in price more widely and to be less liquid than other foreign investments. Investments in small companies generally carry greater risk than is customarily associated with larger companies. This additional risk is attributable to a number of reasons, including the relatively limited financial resources that are typically available to small companies, and the fact that small companies often have comparatively limited product lines. In addition, the stock of small companies tends to be more volatile and less liquid than the stock of large companies, particularly in the short term and particularly in the early stages of an economic or market downturn.
Diversification neither assures a profit nor guarantees against loss in a declining market.
The Bloomberg Barclays US Aggregate Bond Index is a broad-based flagship benchmark that measures the investment grade, US dollar-denominated, fixed-rate taxable bond market. The index includes Treasuries, government-related and corporate securities, MBS (agency fixed-rate and hybrid ARM pass-throughs), ABS, and CMBS (agency and nonagency). Provided the necessary inclusion rules are met, US Aggregate-eligible securities also contribute to the multicurrency Global Aggregate Index and the US Universal Index, which includes high yield and emerging markets debt.
The Bloomberg Barclays US Corporate High Yield Bond Index measures the USD-denominated, high-yield, fixed-rate corporate bond market. Securities are classified as high yield if the middle rating of Moody’s, Fitch, and S&P is Ba1/BB+/BB+ or below. Bonds from issuers with an emerging markets country of risk, based on the indices’ EM country definition, are excluded. The US Corporate High Yield Index is a component of the US Universal and Global High Yield Indices.
The MSCI EAFE Index is an equity index that captures large and mid cap representation across 21 Developed Markets countries around the world, excluding the US and Canada. With 874 constituents, the index covers approximately 85% of the free float-adjusted market capitalization in each country.
The MSCI EAFE Small Cap Index is an equity index that captures small cap representation across Developed Markets countries around the world, excluding the US and Canada. With 2,354 constituents, the index covers approximately 14% of the free float-adjusted market capitalization in each country.
The MSCI Emerging Markets Index captures large and mid cap representation across 27 Emerging Markets (EM) countries. With 1,381 constituents, the index covers approximately 85% of the free float-adjusted market capitalization in each country.
The MSCI Emerging Markets Small Cap Index includes small cap representation across 27 Emerging Markets countries. With 1,692 constituents, the index covers approximately 14% of the free float-adjusted market capitalization in each country. The small cap segment tends to capture more local economic and sector characteristics relative to larger Emerging Markets capitalization segments.
The MSCI US REIT Index is a free float-adjusted market capitalization weighted index that is comprised of equity Real Estate Investment Trusts (REITs). The index is based on the MSCI USA Investable Market Index (IMI), its parent index, which captures the large, mid and small cap segments of the USA market. With 137 constituents, it represents about 99% of the US REIT universe and securities are classified under the Equity REITs Industry (under the Real Estate Sector) according to the Global Industry Classification Standard (GICS®), have core real estate exposure (i.e., only selected Specialized REITs are eligible) and carry REIT tax status.
The MSCI USA Index is designed to measure the performance of the large and mid cap segments of the US market. With 620 constituents, the index covers approximately 85% of the free float-adjusted market capitalization in the US.
The MSCI USA Small Cap Index is designed to measure the performance of the small cap segment of the US equity market. With 1,741 constituents, the index represents approximately 14% of the free float-adjusted market capitalization in the US.
The S&P GSCI index measures commodity market performance through futures. The S&P GSCI is weighted by world production and comprises the physical commodities that have active, liquid futures markets. There is no limit on the number of commodities that may be included in the S&P GSCI; any commodity whose contract satisfies the eligibility criteria and the other conditions specified in this methodology are included.
One cannot invest directly in an index. Index returns do not reflect fees, expenses, or trading costs associated with an actively managed portfolio.
The following article originally appeared in the Financial Analysts Journal, Volume 77, Issue 2, dated March 18, 2021. The article is posted here by permission of the Financial Analysts Journal and the CFA Institute.
The value relevance of financial variables, such as book value and earnings, has decreased for particular industries of high “intangible intensity.”
Overview
Expenditures on the creation of intangible capital have increased, but accounting standards have not kept pace. We investigated whether this has affected the value relevance of book value and earnings. We constructed a composite measure of intangible intensity by which to classify industries. The measure is based on intangible assets capitalized on the balance sheet; research and development expenditures; and sales, general, and administrative expenditures. We show that the value relevance of book value and earnings has declined for high-intangible-intensity companies in the United States and abroad, but for the low-intangible-intensity group, it has remained stable in the United States while increasing internationally.
Please use the click on the following image to read the full article:
Disclosures
The opinions expressed here are exclusively those of Bridgeway Capital Management (“Bridgeway”). Information provided herein is educational in nature and for informational purposes only and should not be considered investment, legal, or tax advice.
Investing involves risk, including possible loss of principal. In addition, market turbulence and reduced liquidity in the markets may negatively affect many issuers, which could adversely affect investor accounts. Value stocks as a group may be out of favor at times and underperform the overall equity market for long periods while the market concentrates on other types of stocks, such as “growth” stocks. International stocks present additional unique risks including unstable, volatile governments, currency risk and interest rate risks.
Diversification neither assures a profit nor guarantees against loss in a declining market.
The Trading Review of 2020 That You’ve Heard About…and the One You Haven’t
I promised myself I would not use the word “unprecedented” when talking about financial market conditions in 2020. In fact, I googled it to try and find alternatives. There are over 30 synonyms for unprecedented. Unfortunately, unprecedented sums up financial market conditions in 2020 accurately. Here is a quick recap of the market this year (all references are to the S&P 500):
The S&P 500 hit a record high on 2/19/2020, and it took only six trading days to decline 10%, the fastest 10% decline from the all-time high on record
On Monday, March 9th, S&P Futures triggered a 7% down single session circuit breaker that hasn’t been triggered since 1997
A Bear market that lasted 4 weeks and had a peak to trough decline of -33.8%
The S&P ended up 18.4% on the year
There was record-setting trading volume in equity, options, and futures
The media have well covered the list above, so now I’d like to mention a couple of things you probably haven’t heard about that I think should have gotten a lot more attention.
2020- The Year that Gamma became mainstream. Gamma?? What the heck is Gamma, and why is everyone on Twitter talking about it? I’ll summarize, Gamma is the rate of change of an options delta. Another way of thinking about it is how fast does an options price change in relation to the move of the underlying security, both up and down. Option market makers must delta hedge their options positions to remain risk-neutral. If they are long Gamma, they typically must buy the underlying asset as it goes down, and sell it as it goes up, which tends to limit volatility as there is two-sided order flow. If, however, they are short Gamma, they typically must sell more of the underlying asset as it goes down and buy more of it as it rises. This can lead to exacerbated price moves on both the upside and downside, resulting in a feedback loop of sorts. This Gamma flow has become much more mainstream since 2020 as it is one of the larger nonfundamental sources of trading flow in the market.
As a former derivatives trader, it warms my heart to hear “Gamma” and its potential flow-driven impact on financial markets becoming more mainstream. The most simplistic way to think about understanding its implications is this: Gamma creates a feedback loop where market participants are forced to buy or sell more of an asset the more it moves in price to maintain a risk-neutral position. If you combine this with high-speed algorithmic trading in financial assets where liquidity is rapidly declining, you can easily see how the magnitude and velocity of the market moves in 2020 are easier to understand.
2020- The year that liquidity vanished! “Wait…. What?” “Didn’t you just say above that equity and option trading volumes were at record highs?” Why, yes, I did, but volume does not mean a market is liquid. Liquidity is typically how much of something you can trade at a certain price point before the market participants require the price point to change to transact more. Liquidity and volatility are linked, creating another one of those feedback loops. When volatility increases, liquidity tends to decline. If I could point to the most compelling/concerning statistic I saw all year it would be this one sentence from a March 12th, 2020 report from Goldman Sachs concerning liquidity in the S&P 500 E-mini futures:
As volatility has spiked, though, electronic futures liquidity has fallen to the point where there has been a median of just ten contracts, representing $1.5mm notional, on the bid and ask of E-mini futures screens over the past week (compared with a median of 120 contracts, representing $18mm notional, in 2019). (Rocky Fishman J. M., 2020)
The S&P 500 product complex, consisting of SPX Index Options, SPY, SPY Options, and E-mini S&P 500 futures and options, is the most widely traded deepest market in the world. The E-mini futures drive the trading in this entire complex and represent over $100 Billion of daily notional value. Now that I’ve set the scene, let’s incorporate the quote above. The most widely traded, deepest market in the world became INCREDIBLY illiquid, with just $1.5 million of notional value offered at its regular trading increment. I don’t know how many ways I can say this to emphasize it enough, a trader with as little as $150,000 could have moved “the market” a tick, or possibly more when we were at the depths of the March 2020 sell-off. A simple 50 lot to buy or sell could have moved through 5 price points or 1.25 points in the S&P. The trouble is it doesn’t work quite so simply. When markets are this illiquid, high-speed traders will pull their quote and revise it in order to transact at a better price as soon as the first execution at the bid or offer takes place. High-speed trading, combined with Gamma-induced feedback loops, in markets with rapidly deteriorating liquidity and large market-on-close (MOC) imbalances in the next 15 minutes. What more could a trader ask for?
I just completed my 22nd year as a trader; I’ve seen a few things……as the saying goes. As a former floor trader, I learned what forced selling felt like, when a clearing firm liquidates accounts, prices be damned, they just need out. It feels different, it sounds different, it looks different, but this…. this was like nothing I’ve seen in my career. The ferociousness, the velocity, even in a world where the screen has replaced trading floors, you could feel it through the screen; it was amazing. I know that at a quant firm, I’m not supposed to describe things by what it feels like; I think the liquidity data cited above backs up what I thought it felt like. Besides, I’ve never heard anyone describe that feeling they get in their belly right when their rollercoaster car tips over the edge of that big downhill slope strictly by the angles and rate of acceleration, so I’m rolling with it!
Summary
So, what the heck does all of this have to do with Bridgeway and its trading, you may be asking? Well, a lot, actually. It’s not just Bridgeway either; every investor from retail to institutional should fully understand the cost of their investments. It’s easy to look at explicit costs; they are stated with a great deal of visibility. Trading costs are implicit and not included in any expense ratio, so it’s wise to pay attention. Our role is to interact as intelligently as possible with the circumstances we must trade in to execute our strategies as designed. Our sole goal is to limit explicit (commissions, fees) and implicit (market impact/unfilled orders). What this means at Bridgeway is a process based on logic, evidence, and data. We all know the importance of research/design and portfolio management, but many ignore the fact that trading is the third, final, and crucial leg of the investment process where value can be destroyed…
For a PDF download of this thought piece, please use the following link:
Rocky Fishman, J. M. (2020). Index Volatility: Wider Equity Future Markets Latest Sign of Weakened Liquidity. NYC: Goldman Sachs.
DISCLAIMER AND IMPORTANT DISCLOSURES
The opinions expressed here are exclusively those of Bridgeway Capital Management (“Bridgeway”). Information provided herein is educational in nature and for informational purposes only and should not be considered investment, legal, or tax advice.
Past performance is not indicative of future results.
Investing involves risk, including possible loss of principal. In addition, market turbulence and reduced liquidity in the markets may negatively affect many issuers, which could adversely affect the mutual funds. Value stocks as a group may be out of favor at times and underperform the overall equity market for long periods while the market concentrates on other types of stocks, such as “growth” stocks.
Diversification neither assures a profit nor guarantees against loss in a declining market.
The S&P 500 Index is a broad-based, unmanaged measurement of changes in stock market conditions based on the average of 500 widely held common stocks. S&P 500 Index Options are option contracts in which the underlying value is based on the level of the S&P 500 Index. SPY options are American-style options and can be exercised anytime between the time of purchase and the expiration date. The S&P 500 E-mini is a futures contract representing 1/5 the value of a standard S&P 500 futures contract. It is not possible to invest directly in an index.
Index returns do not reflect fees, expenses, or trading costs associated with an actively managed portfolio.
Crisis and Opportunity: The Overlooked Role of Ultra-Small Stocks
After a year of uncertainty, historical data suggests looking to the smallest stocks for full exposure to the small-cap premium
With well over 50 combined years of investment experience, we’ve both lived through some monumental world events in our careers. Even with that perspective, it’s still hard to fully comprehend the events of 2020. The global impact of the Covid-19 pandemic, both financially and health-wise, was truly unprecedented. From our headquarters in Houston to Central Africa, where the Bridgeway Foundation performs some vital work, we’ve seen few lives untouched by what has unfolded. Having said that, the business of investing for pensions, insurance companies, foundations, endowments, and individuals must continue. The assets we are privileged to steward at Bridgeway perform vital functions like paying pensions and life insurance settlements, funding philanthropic work, and providing for individual retirees in their golden years. So, despite the challenges we’ve all faced during the pandemic, Bridgeway continues to focus on this critical work, while also funding organizations serving those in need.
From an investment perspective, the shock to markets in Q1 2020 was followed by an equally astounding whipsaw recovery and rally. Now, well into Q1 2021, we see the broad market at new highs nearly every day. Growth stocks have outperformed value stocks for the past 10 years, and large caps still outpace small caps over the decade, despite strong returns for small-cap stocks in Q4 2020. As in previous periods of uncertainty and anxiety, like the 2000 Tech Bubble and the 2008-2009 Global Financial Crisis, we are regularly asked about markets, sectors, earnings, inflation, and other financial concerns. But the real question behind most of these questions boils down to the same thing: “Where do we see opportunities to invest?”
Although we certainly see several attractive areas, US small-cap stocks appear to be poised for a potential once-in-a-decade opportunity. As contrarians and practitioners of factor-based investing, our optimism on US small-cap stocks should be no surprise given their most recent decade-long underperformance relative to US large-cap stocks. Many investors are aware that over long periods, small caps have outperformed large caps (the small-cap premium)—but this hasn’t been the case for the past decade. We believe this presents a compelling opportunity in terms of reversion to long-term levels.
While US small-cap stocks present an attractive opportunity, we are especially excited about the “ultra-small” portion of the US small-cap market; at Bridgeway, we define these companies as “the smallest-of-small caps.” To make the case succinctly, the following chart reflects performance data going back to 1926 for stocks in different market caps, compiled by the Center for Research in Security Prices (CRSP).
As you can see from the CRSP data, the smallest decile of publicly traded US companies (CRSP 10) have a nearly century-long track record of outperformance relative to the largest, mega-cap firms (CRSP 1). Contrast that with the last decade (as represented by the yellow bars above), which has seen this smallest decile of companies lag their largest counterparts by nearly four percent on an annualized basis. As ardent contrarians, this dislocation between large and ultra-small stocks over the past 10 years shouts “Big Opportunity” because historically, after dramatic periods of underperformance, we regularly see a reversion to long-term levels.
And while we think the ultra-small segment of the market is especially attractive now, we saw this opportunity years ago and began buying ultra-small stocks in the early 1990’s. Understanding that this opportunity could be attractive to institutional investors, we launched our first strategy focused on this segment in 1994. The investment thesis then, as now, was to build a portfolio focusing primarily on the CRSP 10 portion of the market to capitalize on the premium offered there.
Today, just like in 1994, another BIG reason we think US ultra-small stocks are a great opportunity is because so few investors, especially institutions, allocate here. It’s a hole in most portfolios, and frankly, this omission is perplexing. When we recently reviewed allocations of some large public pension funds, we observed allocations to Eastern European private equity, emerging markets infrastructure, and a commitment to Latin American private credit, to name just a few. While we applaud these investors’ efforts to diversify returns, we also find it head-scratching that many investors have overlooked a not-insignificant portion of the largest, most shareholder-friendly public equity market right in their own back yard.
For some investors, the decision to bypass investing in ultra-small stocks is simply, “I don’t know where this goes in my portfolio.” This question is certainly appropriate, as investors should ask themselves what role every investment has in their portfolio. For those considering what role ultra-small stocks should play in their portfolio, we believe there are two approaches that are most appropriate: a liquid alternative to private equity or an extension of a small-cap allocation. While we believe there are many parallels with private equity, particularly when it comes to the size of these companies, for the sake of this piece, we’ve focused on how ultra-small stocks complement a broader small-cap portfolio.
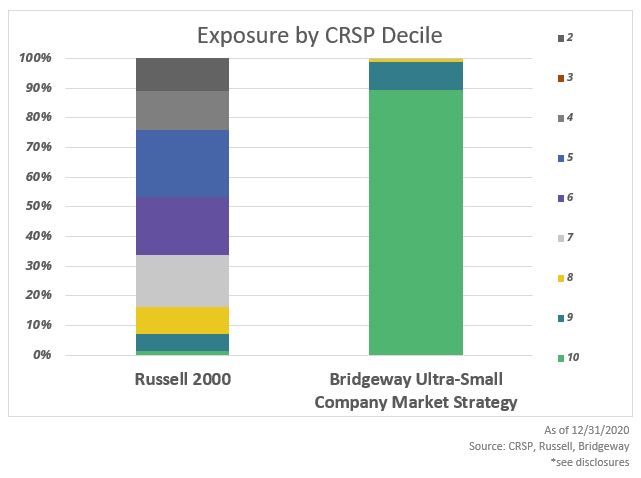
A “completion strategy” makes sense once we take a closer look at the composition of the Russell 2000 Index (“Russell 2000”), the benchmark for most investors’ US small-cap investments. As shown in the chart below, reviewing the Russell 2000 composition by CRSP decile reveals that CRSP 9 and 10—the smallest of small-cap stocks—have scant representation. In comparison, our Ultra-Small Company Market strategy is almost entirely allocated to the two smallest deciles.
Most investors allocate to small caps because they believe in diversification and the small-cap premium. Yet, many have overlooked one of the most historically robust segments of the US small-cap universe that contributes to that premium. Adding an ultra-small stocks sleeve to a typical Russell 2000 allocation simply fills out a small-cap portfolio and more comprehensively exposes those investments to that small-cap premium.
We would be remiss if we did not address another common objection we encounter when discussing investing in this sub-set of the market: liquidity. At a high level, this is a valid concern. For institutions with billions of dollars, investing in ultra-small companies can present liquidity challenges in terms of building or redeeming positions or being too large of a holder of an individual company. That said, we would point back to the private market investments we mentioned earlier. Institutions regularly allocate capital to private equity and then slowly (often over quarters or even years) see that capital called and put to work, then agreeing that those funds will be tied up for years; this is the very definition of illiquidity.
However, in our experience, even the largest investors could build out a portfolio of ultra-small stocks over the course of days or weeks (not quarters or years) without unduly moving markets or being too large of a stockholder. It would require a transparent conversation between investor and manager, with expectations and targets set accordingly. Certainly, a little patience would be required, too. However, as long-term investors, the “patient capital” should be able to withstand a minuscule amount of liquidity concerns particularly if they are already investing in inherently illiquid, seldom-priced strategies elsewhere across the portfolio.
In summary, we are optimistic about opportunities now in the ultra-small segment of the US equity market. Very likely, there are other attractive opportunities in the market; a casual look across the industry shows no shortage of investors considering allocations to distressed debt and real estate, to name a few. There may be some compelling stories in those parts of the market and others. However, we come back to one simple observation: How have US investors grown comfortable with increasingly complex, illiquid, and esoteric strategies without fully capitalizing on the full spectrum of the domestic equity market right in their own backyard?
For a PDF download of this thought piece, please use the following link:
The opinions expressed here are exclusively those of Bridgeway Capital Management (“Bridgeway”). Information provided herein is educational in nature and for informational purposes only and should not be considered investment, legal, or tax advice.
Past performance is not indicative of future results.
Investing involves risk, including possible loss of principal. In addition, market turbulence and reduced liquidity in the markets may negatively affect many issuers, which could adversely affect the mutual funds. Value stocks as a group may be out of favor at times and underperform the overall equity market for long periods while the market concentrates on other types of stocks, such as “growth” stocks.
Diversification neither assures a profit nor guarantees against loss in a declining market.
The Russell 2000 Index measures the performance of the small-cap segment of the US equity universe. The Russell 2000 Index is a subset of the Russell 3000 Index representing approximately 10% of the total market capitalization of that index. It includes approximately 2000 of the smallest securities based on a combination of their market cap and current index membership. The Russell 2000 Index is constructed to provide a comprehensive and unbiased small-cap barometer and is completely reconstituted annually to ensure larger stocks do not distort the performance and characteristics of the true small-cap opportunity set. One cannot invest directly in an index.
The Center for Research in Security Prices (“CRSP”) US Stock Databases contain daily and monthly market and corporate action data for over 32,000 active and inactive securities with primary listings on the NYSE, NYSE American, NASDAQ, NYSE Arca and Bats exchanges and include CRSP broad market indexes. CRSP databases are characterized by their comprehensive corporate action information and highly accurate total return calculations.
Unless you have been living in your bed, bath, and not much further beyond, you may have noticed some unusual stock activity recently. Whether it’s single stocks that jump in multi-fold like a game that won’t stop or just sitting back watching the movie plot unfold, it seems like everyone wants to express an opinion one way or the other.
We’ve been getting many questions about how this activity has impacted our portfolios and wanted to summarize our viewpoint as a statistical, evidence-based manager.
Statistical, evidence-based investing may sound intimidating, but at the most basic level, it’s defining quantitative rules and then systematically applying those rules in your investing process. At Bridgeway, we believe that factors shape returns. Factors are nothing more than themes or characteristics of groups of securities, such as stocks. We have followed a systematic process for the past 28 years. That doesn’t mean crazy stuff can’t happen in the short term, but we believe that fundamental characteristics explain stock returns over the long term. Thus, the reason why we would enter a position is not going to be based on speculation, but due to a factor or theme that we believe in, such as value, company financial health, momentum, and size.
We also believe in diversification in many aspects. That means we diversify not only our factor exposures, models, and holdings but our team. One of the main reasons for diversification is risk management. A well-diversified portfolio limits the potential downside exposure to any specific name. This would also apply to the upside as well. If a stock has a large move up, we will consider trimming it for risk considerations to continue to meet the portfolio’s desired exposures.
While we get most asked about how stocks enter our portfolio, determining how names exit is just as important. Every position established at Bridgeway adheres to a set of disciplined sell rules. Does that mean that we just set it and forget it? Of course not. We are continually monitoring positions and movements. There’s the chance that earlier action will be taken due to risk considerations, tax consequences, or other portfolio changes, such as if the reason why we bought the stock no longer holds. These considerations are quantified and set ahead of time; decisions are not made on the fly when emotions and other behavioral biases may be at play.
This rules-based flexibility highlights a benefit of systematic investing versus pure indexing. If you are tied directly to an index, by and large, that flexibility no longer exists. To track an index, you must buy and sell precisely when the index dictates, even if that means buying at the high and selling at the low.
Does this mean we will get it exactly right every single time? It might be surprising to say – but probably not. Especially with speculative cases, it may be tough to nearly impossible to hit the top. But the discipline of our investment process allows us to have a set process in place, realizing gains along the way without putting the portfolio at extreme risk. We humbly know that there’s always more to learn and believe in the process of seeking continuous improvement. We stay curious, in line with our principles of relational investing.
I know we all love stories, and often that extends to story stocks. But a disciplined, systematic process will allow you to invest well, sleep well, and leave the entertainment in the theatres.
If you would like to share a story or have a question for a member of our Client Service and Marketing team, email us at info@bridgeway.com or call 713-661-3500, option 1.
For a PDF download of this thought piece, please use the following link:
DISCLAIMER
The opinions expressed here are exclusively those of Bridgeway Capital Management (“Bridgeway”). Information provided herein is educational in nature and for informational purposes only and should not be considered investment, legal, or tax advice.
Measuring Intangible Capital Intensity: A Global Analysis
Bridgeway’s research leads to a new framework for addressing intangible assets in equity portfolios.
Stay curious is one of Bridgeway’s principles of relational investing.1 In keeping with our principles, our team has investigated and developed a new framework for analyzing intangible assets in equity portfolios. For decades, equity investors have relied on stock valuations, as well as the growth, profitability, and risk characteristics of companies. Yet the economy has undergone structural changes in recent years that have opened up opportunities for investors seeking to enhance their investment strategies.
Specifically, companies increasingly rely on intangible assets to drive their business models. Across a broad swath of industries around the world, we’ve seen intangible assets displacing traditional, physical assets on corporate balance sheets and affecting income statements. What’s more, differences in accounting standards between the US and international markets mean that companies are not following the same requirements for expensing or capitalizing many types of spending that create intangible assets, creating potential differences in statements of a company’s book value.
In response to this trend, investment researchers and practitioners have been investigating the potential impact of intangibles on stock prices. Some studies have attempted to quantify the impact of spending on intangibles on contemporaneous stock prices and future returns. Other studies have looked at techniques for adjusting fundamental metrics to account for the effects of specific types of intangibles. Above all, most research has focused only on US stocks, and international research on this issue is sparse. For Bridgeway’s detailed review of existing research into the effect of intangible assets on stock prices, please request a copy of our white paper “Equity Investing in the Age of Intangibles” by Amitabh Dugar and Jacob Pozharny.
As Bridgeway began designing our international developed and emerging market equity strategies, we saw an opportunity to investigate a different approach for dealing with the rise of intangible assets. Rather than attempting to adjust valuation metrics, we explored the idea of analyzing and ranking companies based on the degree to which they create and rely on intangible assets—known as Intangible Capital Intensity. And we included a global set of companies in our study. That way, we could then examine which fundamental metrics are most relevant for various companies and industries according to their degree of Intangible Capital Intensity.
Our research in this area has allowed us to create a new composite metric we call Intangible Capital Intensity. We believe this framework is flexible enough to accommodate different forms and magnitudes of intangible capital across the global economic landscape, and capable of evolving through time to reflect structural changes in the economy. We also discovered that this ranking system may be especially useful for international investors, because the impact of Intangible Capital Intensity on the association between stock prices and fundamental financial variables such as earnings and book value is strongest for international companies.
Defining Intangible Capital Intensity Metrics
Based on our study of accounting theory and our review of existing intangible research, Bridgeway designed its Intangible Capital Intensity composite to capture the impact of three types of intangible capital:
Intangible assets reported on the balance sheet (excluding goodwill)
Innovation capital created by research & development expenditures
Organization capital resulting from sales, general & administrative expenses.
Intangible Assets (Excluding Goodwill)
In theory, any intangible assets reported on the balance sheet are already included in book value, so it may seem counterintuitive to include them in a composite Intangible Capital Intensity measure. In practice, however, spending on these intangible assets can still understate a company’s book value because those expenditures—and their impact on earnings—have increased dramatically. For example, the Telecom Services industry has had some of the highest growth in intangible assets on the balance sheet. This reflects spending on assets such as wireless licenses and subscriber lists, and costs of customer retention. We also reviewed research evidence from around the globe demonstrating that several types of intangible expenditures that were capitalized and reported on the balance sheet were value relevant, both in aggregate and individually.2
We choose to exclude goodwill from our measurement because our objective is to focus on forms of intangible capital investments that have become more important amid the rapid transformation in corporate investment and business models during the past few decades; in contrast, goodwill is an accounting by-product of business combinations. In addition, prior evidence regarding the value relevance of goodwill is mixed.
Research & Development Expenses
While US accounting standards require the cost of both research and development (R&D) to be expensed, International Financial Reporting Standards (IFRS) are a bit less restrictive, allowing the capitalization of development costs. Nevertheless, we see evidence in both international and US research to indicate that R&D expenditures create (intangible) innovation capital that is reflected in equity market values.3
Sales, General & Administrative Expenses
Viewed broadly, expenditures to create intangible capital can lead to a variety of assets such as human capital, customer lists, and proprietary IT systems/software that enhance efficiency, productivity, sales, or customer satisfaction. Sales, General & Administrative (SG&A) expenditures may capture many of these types of intangible capital— collectively dubbed as organization capital.
Our framework seeks to measure the recorded intangible assets, innovation capital, and organization capital (i.e., the composite Intangible Capital Intensity) of firms around the globe in all industries, excluding banks, insurance and diversified financials. We excluded these three industries because their atypical financial reporting practices affect the metrics, we use to gauge Intangible Capital Intensity. For example, due to the nature of their business, banks bundle and report several types of operating expenses in the category of SG&A expenses.
Ranking Industries According to Intangible Capital Intensity
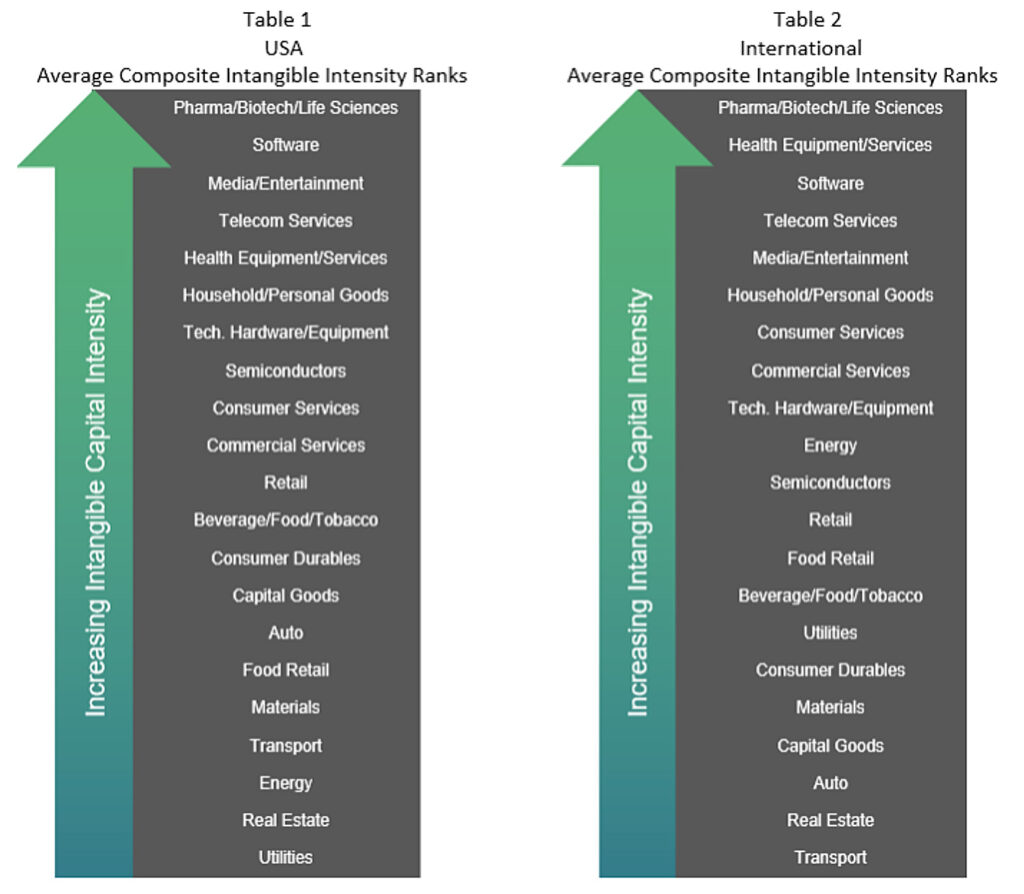
To create our Intangible Capital Intensity composite rankings, we examined a global sample of companies from among the top 15 countries in the world ranked by their 2018 GDP (according to the World Bank). For each of those companies, we computed total intangible assets excluding goodwill relative to total assets; and research & development and SG&A expenses relative to total revenues for the years 1992-2018.4
Those company-specific calculations allowed us to compute the median Intangible Capital Intensity for our three metrics across all firms within each of 21 GICS industries, so we could rank those industries annually according to their median Intangible Capital Intensity in both the US and international markets. Finally, we combined each industry’s annual rank on the three Intangible Capital Intensity metrics to obtain its equally weighted composite Intangible Capital Intensity rank for each of the 27 years in our sample period. Tables 1 and 2 show the 27-year average composite Intangible Capital Intensity ranking of industries for the US and international investment universes. You’ll see that the order of industries according to their average composite Intangible Capital Intensity ranks is remarkably similar.
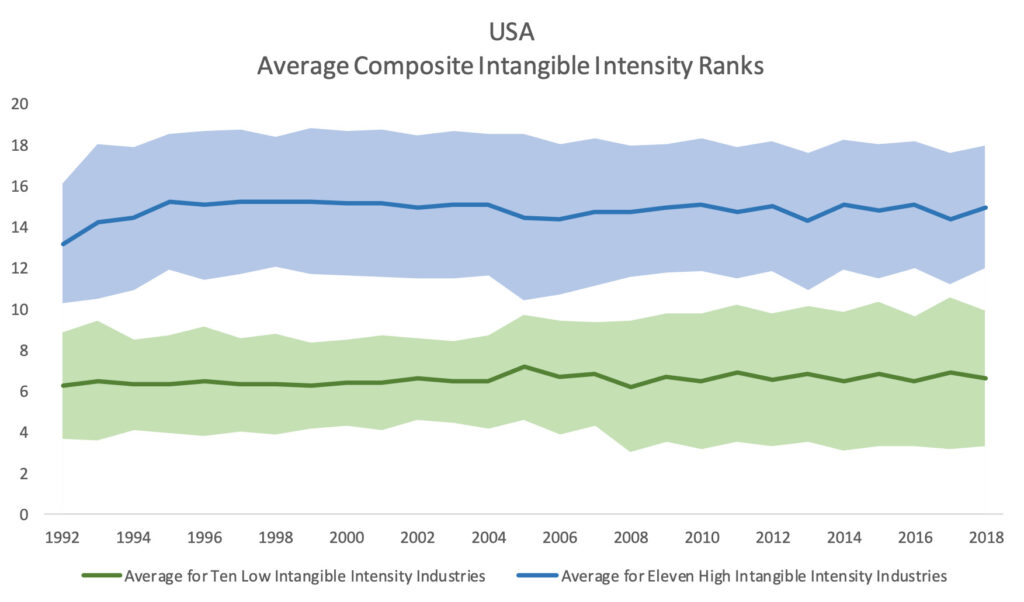
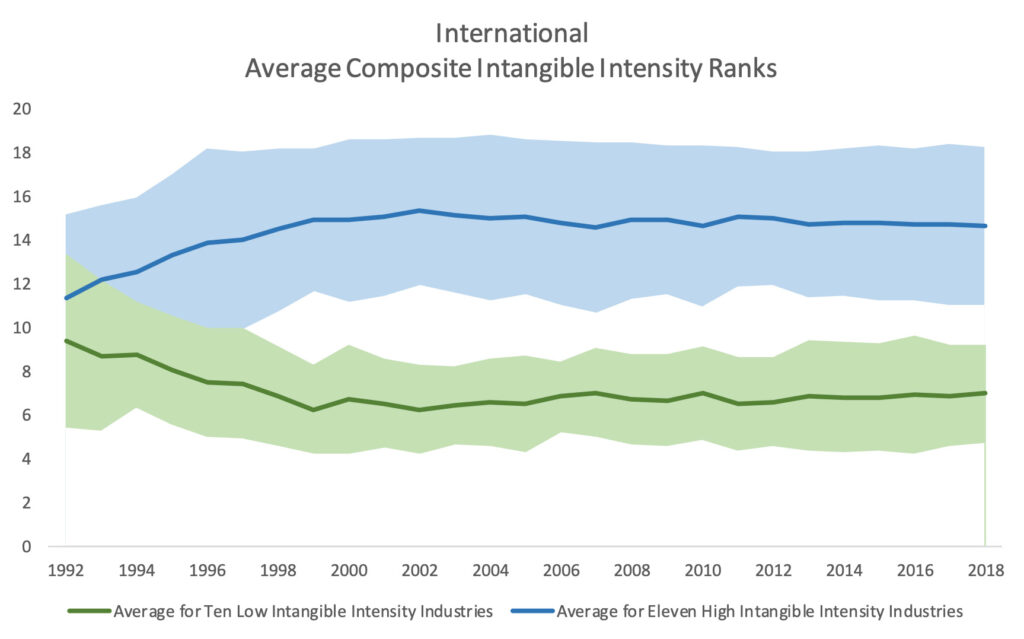
The results in Tables 1 and 2 demonstrated to us that these intangible metrics are pervasive. We also found that the average of the 21 industries were remarkably consistent over time. Figures 1 and 2 below show the 27-year trend of those average ranks within a one standard deviation band. This is an important finding, because the pace of evolution of Intangible Capital Intensity for each industry and for each type of intangible capital varies during that decades-long time period. Because of that persistence, we believe that our composite measure of Intangible Capital Intensity provides some assurance that investment strategies based on the choice or weighting of factors according to Intangible Capital Intensity are likely to be stable and replicable.
Source: S&P Capital IQ, Bridgeway AnalysisSource: S&P Capital IQ, Bridgeway analysis
Despite these similarities in the average Intangible Capital Intensity, we also observed a key difference: The difference in the book value and earnings to explain contemporaneous stock prices in high versus low Intangible Capital Intensity groups is greater in international markets than in the US market.5 That divergence has also become greater among international companies, while it has remained stable in the US. Therefore, this framework may be especially useful for international investment strategies that want to adapt traditional equity investment analysis techniques to handle the effect of variations in Intangible Capital Intensity across firms and industries within the confines of the current financial reporting framework.
The Benefits of Categorization
Bridgeway’s research on intangibles makes three important contributions. First, because investors rely on book value and earnings to assess valuation ratios and various profitability, growth, and risk measures, our research finding that the relationship between these financial variables and contemporaneous stock prices has weakened for high Intangible Capital Intensity companies and has implications for many types of investment strategies. Second, our finding that this has occurred for both US and international companies in the largest fourteen economies of the world is a noteworthy advancement. Third, our composite measure of Intangible Capital Intensity captures the aggregate impact of three different types of intangible capital and can help investors consistently rank and classify industries over time and across countries.
Our research provides a repeatable framework to help investors choose or weight factors based on Intangible Capital Intensity when constructing global investment strategies. Importantly, our conclusions about the impact of Intangible Capital Intensity on the relevance of earnings and book value are stronger for international companies in that the divergence between the low and high Intangible Capital Intensity groups of industries is greater and has continued to increase over time.
Thus, our research shows that the Intangible Capital Intensity composite can be an effective tool for our international and emerging market equity strategies. That work has also laid the groundwork for further areas of research, motivated by a variety of questions. Can equity investors improve their assessments of a firm’s profitability, quality, growth, and risk by accounting for cross-sectional variations in Intangible Capital Intensity? Do we expect performance of value, quality and trend factors to be different based on Intangible Capital Intensity category? How should an investment manager think about factor applications using an Intangible Capital Intensity framework? Based on the broad relevance of this topic for investors, we believe these are important questions to study. As the economic landscape continues to emphasize intangible assets in addition to physical ones, investors will increasingly need new insights to help guide investment strategies, and Bridgeway will stay curious in line with our principles of relational investing.
1Relational investing bridges the gap between results for investors and returns for humanity with a modern approach to asset management. As a leader in relational investing, Bridgeway takes a statistical, evidence-based investment approach motivated by a passion for servant leadership and global impact which we accomplish by donating 50% of our firm profits to organizations making a positive impact for humanity. For more detail, please see http://bridgeway.com/perspectives/an-open-letter-on-relational-investing/
2Oliveira, Rodrigues and Craig (2010) for a sample of Portuguese firms, Ritter and Wells (2006) and Dahmash, Durand and Watson (2009) for the Australian market, and Lev and Aboody (1998) in their study of capitalized software development costs in the US.
3Ahmed and Falk (2006) for a sample of Australian firms, Zhao (2002) for firms in France, Germany, UK and US, Smith, Percy and Richardson (2001) based on data from the Australian and Canadian markets, and the seminal paper by Lev and Sougiannis (1999), who estimate the R&D capital of a sample of more than 800 manufacturing companies.
4Analysis begins in 1992 as the company-level financial statement data available in S&P Capital IQ’s database was insufficient to permit construction of reliable intangible intensity ranks for prior years.
5For more detail and supporting evidence, please request Bridgeway’s white paper “Equity Investing in the Age of Intangibles”.
Disclosures
The opinions expressed here are exclusively those of Bridgeway Capital Management (“Bridgeway”). Information provided herein is educational in nature and for informational purposes only and should not be considered investment, legal, or tax advice.
Investing involves risk, including possible loss of principal. In addition, market turbulence and reduced liquidity in the markets may negatively affect many issuers, which could adversely affect investor accounts. Value stocks as a group may be out of favor at times and underperform the overall equity market for long periods while the market concentrates on other types of stocks, such as “growth” stocks. International stocks present additional unique risks including unstable, volatile governments, currency risk and interest rate risks.
Diversification neither assures a profit nor guarantees against loss in a declining market.
Heard enough already about value’s underperformance and why the evidence suggests staying the course? Just in case not, we will live our relational investing1 principle of stating where we stand and briefly summarize our research on value overall in the US market. More importantly, we will move from Wall Street down a different street with a focus on US small-cap value for a discussion of One of These Is Not Like the Others2.
Overall US Value
Looking at the US stock market back to 19263, it’s pretty obvious to see that One of These (Columns) Is Not Like the Others. In general, over the entire period of history, the right most column with the deepest value exposure has had distinctly higher returns than others.
US Stock Market Since 7/1926 (Annualized, %), as of 9/30/2020
Growth
Mid-Gro
Mid
Mid-Val
Value
Big
9.97
9.54
10.27
8.65
10.44
Med-Big
10.38
10.76
11.61
12.37
11.62
Medium
9.21
12.28
12.22
13.37
12.66
Med-Sml
7.55
11.77
12.48
13.06
14.29
Small
2.62
6.67
11.04
13.86
15.39
Source: Bridgeway, Ken French data library4, total US stocks formed into 25 portfolios based on size exposure defined by market capitalization and value exposure defined by price to book ratios.
For most value investors though, the past one, five, and 10 years has proven instead that One of These (Time Periods) is Not Like the Others. Notably, the results in the most recent decade are the opposite of the results back to 1926.
US Stock Market Last 10 Years (Annualized, %), as of 9/30/2020
Growth
Mid-Gro
Mid
Mid-Val
Value
Big
18.11
13.41
11.62
7.24
7.48
Med-Big
16.66
13.73
10.29
7.98
6.45
Medium
13.72
14.06
9.34
10.42
3.47
Med-Sml
14.60
13.03
9.78
6.76
6.86
Small
7.92
12.12
8.27
7.83
7.66
US Stock Market Last 5 yr (Annualized, %), as of 9/30/2020
Growth
Mid-Gro
Mid
Mid-Val
Value
Big
21.75
13.31
9.72
2.70
4.94
Med-Big
18.48
12.98
9.17
0.36
1.80
Medium
13.21
11.14
6.57
7.09
-1.52
Med-Sml
15.80
12.89
6.79
1.25
3.35
Small
12.19
11.60
7.84
3.49
4.20
US Stock Market 1 Year (%), as of 9/30/2020
Growth
Mid-Gro
Mid
Mid-Val
Value
Big
40.83
13.57
-2.01
-20.60
-16.12
Med-Big
33.35
8.53
-4.78
-18.65
-26.69
Medium
22.64
14.73
-12.12
-6.20
-26.65
Med-Sml
27.58
4.78
-8.38
-22.00
-10.05
Small
31.49
30.96
2.44
-15.21
-8.49
Source: Bridgeway, Ken French data library4, total US stocks formed into 25 portfolios based on size exposure defined by market capitalization and value exposure defined by price to book ratios.
Based on the long-term evidence, the long and deep drawdown of value in the US is not surprising (though it’s still not fun). It has happened before with value, the overall stock market, and other factors. While challenging to endure, underperformance provides confirming evidence of exposure to different sources of risk that investors should seek. Put another way, this underperformance is a manifestation of the “risk” portion of “risk premium” that ultimately has been rewarded; the higher historical returns of value are not a free lunch and require a strong stomach.
On the positive side, historical evidence for value gives us optimism for the coming decade. In the US, value5 has outperformed growth6 91% of the time over rolling 10-year periods going back to 1926. Over those same periods, the US stock market7 has only outperformed the risk-free rate 86% of the time; thankfully, investors don’t typically question the benefits of staying the course with stocks over cash, and we believe the same holds for staying the course with value stocks.
So, what about small-cap value in the US? As with value in the market overall, the results for small-cap value over the last decade are starkly different than long-term results back to 1926.
As the tables above and chart below shows for the period back to 1926, there has been a 2.33% annualized benefit in return for the very smallest and most value companies (15.39%) shown in the bottom row and last column of each table, compared to the next smallest and next deepest value companies (13.06%) shown in the fourth column and fourth row of each table for almost 95 years. On the other hand, for the last 10 years, the benefit was only 0.90% annualized for the additional small value exposure even after including a 13.51% advantage in the last year.
Source: Ken French data library and Bridgeway calculations. See disclosures for more information.
This concept is important to remember as we think about if One of These (Portfolios) Is Not Like the Others. The variation of returns reminds us that the level of capitalization and value exposure truly matters even among different small-cap value strategies.
When a segment of the market does well, investors should expect the portfolio with the most exposure to the factors explaining the segment’s outperformance to have the highest return. And when a segment of the market does poorly, investors should expect that same portfolio with the most exposure to the factors will underperform.
Performance across small-cap value portfolios can diverge significantly, particularly when the asset class is either doing significantly better or worse than the overall US market. This has definitely been the case over the last decade. Divergence is usually driven by meaningful differences in size of companies held, valuation of companies held, measures of value used, and differences in allocations across sectors like REITs and utilities. These performance differences rarely indicate that a portfolio is not efficiently delivering the expected returns. Instead, performance differences arise because of differences in portfolio design. A portfolio focused on the stocks with smaller size and deeper value will indeed not look like other small cap value portfolios lacking that depth of exposure.
Conclusion
So, as we sit in one of those periods that has not been like the others, what can investors do? We at Bridgeway focus on the intersection of what matters and what we can control and have discovered the power in the paradox that often the best thing for investors to do is “very little”
As leaders in relational investing, we suggest being guided by principles and staying invested in your outcome. Diversification is a crucial concept for all investors, and for Bridgeway it includes not just the way we invest but also how we run our firm and the people we hire. We do not make dramatic changes to our portfolios because we are in a pandemic, recession, bear market, or other challenging time, and we think all investors should avoid the temptation. These moves are potentially costly in terms of trading needed to implement those changes and the substantial risks of not getting that timing call exactly right.
For a PDF download of this thought piece, please use the following link:
1Relational investing bridges the gap between results for investors and returns for humanity with a modern approach to asset management. As a leader in relational investing, Bridgeway takes a statistical, evidence-based investment approach motivated by a passion for servant leadership and global impact which we accomplish by donating 50% of our firm profits to organizations making a positive impact for humanity. For more detail, please see http://bridgeway.com/perspectives/an-open-letter-on-relational-investing/
2If this reference is lost on you, at least one of the authors grew up on Sesame Street and fondly remembers the song “One of These Things”
3US stocks as defined by the Ken French Data library. See disclosures for more information.
4See disclosures for more information. The portfolios shown in each row and column are the intersections of 5 portfolios formed on size (market capitalization) and 5 portfolios formed on the ratio of price/book as constructed in the Ken French data library. The size breakpoints for each year are the NYSE market capitalization quintiles at the end of June of each year shown in each row of the table. Big refers to the largest quintile in terms of market capitalization, Med-Big refers to the 2nd largest, Medium refers to the 3rd largest quintile, Med-Sml refers to the 4th largest quintile, and Small refers to the smallest quintile. Price/book for June of each year is the market capitalization in December of the prior year divided by book value for the previous year’s fiscal year end. The breakpoints for each column are NYSE quintiles. Growth refers to the highest price/book quintile which have the least value exposure, Mid-Gro refers to the 2nd highest price/book quintile, Mid refers to the 3rd highest price/book quintile, Mid-Val refers to the 4th highest price/book quintile, and Value refers to the lowest quintile in terms of price/book which have the strongest value exposure.
5Using HML (high minus low) for value and growth and US stock market defined as Rm-Rf with the data and methodology from the Ken French data library. See disclosures for more information. Rm-Rf includes all New York Stock Exchange, NYSE American, and Nasdaq firms. HML for July of year t to June of t+1 includes all New York Stock Exchange, NYSE American, and Nasdaq stocks for which they have market equity data for December of t-1 and June of t, and (positive) book equity data for t-1.
6See Footnote 5
7See Footnote 5
DISCLOSURES
The opinions expressed here are exclusively those of Bridgeway Capital Management (“Bridgeway”). Information provided herein is educational in nature and for informational purposes only and should not be considered investment, legal, or tax advice.
Past performance is not indicative of future results. All returns are gross of any fees and expenses an investor would pay.
Investing involves risk, including possible loss of principal. In addition, market turbulence and reduced liquidity in the markets may negatively affect many issuers, which could adversely affect the mutual funds. Value stocks as a group may be out of favor at times and underperform the overall equity market for long periods while the market concentrates on other types of stocks, such as “growth” stocks.
Diversification neither assures a profit nor guarantees against loss in a declining market.
Data sourced from the Ken French data library uses their definitions and methodology although Bridgeway has used our preferred terminology in some cases. Price/book is Bridgeway’s preferred term which refers to the reciprocal of book equity to market equity data from the Ken French data library. US portfolios include all New York Stock Exchange, NYSE American, and Nasdaq stocks for which they have market equity data for the prior December and June, and (positive) book equity data for the prior year.
Bear markets and recessions are not identical, but investor responses should be. Staying the course with multi-factor diversification through bears and recessions is our suggested course of action based on a review of the evidence. This thought capsule is a follow-on to our analysis of recessions and factor performance.
By Andrew L. Berkin, Ph.D., Head of Research, and Geoffrey G. Crumrine, Head of Client Service and Marketing
In the early spring of 2020, investors found themselves in a situation they hadn’t experienced for a decade: Confronting a bear market. Global stock markets tumbled in February and March over concerns about the economic impact of the coronavirus pandemic. The S&P 500 Index, which had reached a high on February 19, ultimately fell more than 33% from its peak until bottoming out on March 23—putting the index well into bear territory.
Subsequent economic stimulus efforts from the U.S. government helped improve investor sentiment and stocks began to recover over the following months. Those gains drove the S&P 500 back to a new record high in late August 2020, signaling the end of the bear market. Despite the apparent short duration of the latest bear, stocks remain volatile and many investors are still wary about the future. However, bull and bear market cycles are to be expected when pursuing a long-term investing strategy. Unfortunately, we can’t predict when bear markets will occur or how long they will last, and we can’t control the external factors that help dictate broad market movements. But we can examine historical data to understand how portfolios have performed during past bear markets.
Following up on our recent analysis of recessions and factor performance, we wanted to take a similar deep dive into the phenomenon of bear markets and the performance of the underlying factors that shape stock returns. Bridgeway’s previous research into past recessions uncovered data that emphasizes the fact that it’s risky to try to time both the economic cycle and the market’s performance. Individual factors don’t move in lockstep during recessions. It’s not surprising, then, that we observe similar patterns in the historical record for factor performance before, during and after bear markets. But just as recessions and bear markets are distinct events, factor performance isn’t identical during each.
A Broad Look at Bear Markets Throughout History
Markets typically are considered to be in bear territory when they have fallen by 20% from their highs. Since 1926 through February 2020, we’ve identified eight bear markets according to this 20% peak-to-trough decline convention (not including the most recent February-March downturn)1.
The chart below illustrates this history. The line shows the growth of $1 invested in the broad stock market, with red sections representing bear markets and blue sections representing bull markets. Overlaid on this graph, we’ve also plotted economic recessions, represented by grey bars.
Sources: Ken French Data Library, NBER, and Bridgeway calculations
First, we note that one dollar invested in the stock market in July of 1926 would have grown to more than $7,500 by the start of 2020. Despite recessions and bear markets, many stocks have been an excellent investment over the long term. In fact, we could replace the word “despite” in the previous sentence with the phrase “because of.” Stocks are a risky investment, but this risk comes with the potential for the higher rates of return that reward investors.
Interestingly, we also see that bear markets and recessions often—but not always—overlap. Since 1926, the market experienced 15 recessions and 8 bear markets. Even when recessions and bear markets coincide, they don’t share exact start and end dates. And sometimes, we have recessions without bear markets or bear markets without recessions. One example is the 1987 bear market, which includes the October 19 market crash often referred to as Black Monday. Although a painful bear market, it did not have a corresponding recession attached.
What are Factors?
Factors are the specific characteristics of stocks and other securities that both drive their returns and explain their performance across different market conditions and business cycles. For further discussion, please see the book “Your Complete Guide to Factor-Based Investing” by Andrew L. Berkin and Larry E. Swedroe.
Factor Performance and Bear Markets
While the data above displays how the overall market has performed since 1926, we also analyzed how individual factors performed before, during, and after bear markets. Table #1, below, shows average factor returns for Fama-French factors and momentum relative to market environment.
Table #1: 8 Bear Markets Going Back to June 1926
Fama-French Plus Momentum Factors, Average Monthly Returns (%)
Market premium (Mkt-RF)
Small size (SMB)
Value (HML)
Momentum (MOM)
Profitability (RMW)
Conservative investments (CMA)
All Months
0.67
0.19
0.35
0.66
0.26
0.27
Bull Markets
1.27
0.27
0.29
0.52
0.14
0.12
Bear Markets
-3.70
-0.34
0.76
1.64
1.10
1.32
12M Pre Bear Mkt
1.76
0.14
-0.03
1.44
-0.24
0.21
12M After Bear Mkt
3.25
1.02
1.16
-2.06
-0.24
0.26
*Average returns through January 2020. Mkt-RF, SMB, and HML data starts in July 1926. Momentum data starts in January 1927, and profitability and investment factors data start in July 1963 Source: Ken French Data Library and Bridgeway calculations
As we see in the second row, all factors did well in the more prevalent bull market months, although the company financial health related metrics of RMW and CMA were weaker than typical. Row three shows that, as expected, the market factor (Mkt-RF) was strongly negative during bear markets but recovered especially well in the 12 months following. Stocks tend to rebound dramatically after a bear market. There is an old saying that no one rings a bell at the top or the bottom of the market. Timing the markets is difficult, and as the recovery from bear markets shows, missing out can be quite costly.
The performance of other factors is quite different depending on the period. Small stocks suffered during the risk-averse times of bear markets but performed strongly in the recovery. In contrast, value stocks held up quite well during bear markets. Noting that value is negative on average in the 12 months beforehand provides some insight into this behavior. The market environment before the onset of a bear is often characterized by exuberance, with growth-led rallies. However, value has come back into favor during the ensuing downturn and subsequent recovery. The aftermath of the late 1990’s technology bubble is a well-known example of this pattern.
Perhaps somewhat surprising is the behavior of momentum, which generally holds up quite well during bear markets but fails miserably afterwards. This pattern was first described by Cooper, Guillen and Hamid.2 When markets bounce back, those stocks that have lost the most often lead the recovery, and momentum suffers. (For more in-depth analysis, see the Bridgeway white paper “When and Why Does Momentum Work – and not Work?” by Andrew L. Berkin.)
When we compare these returns to our previous analysis of factor returns during recessions, we see many similarities—but also important differences. For example, factors related to company financial health (RMW and CMA) perform strongly in both recessions and bear markets, as investors favor higher quality companies in both environments. In fact, the returns for RMW and CMA are even stronger in bear markets than they are in recessions. However, the performance of these two factors diverges in the aftermath of the different events. The profitability factor RMW, which has stronger-than-average returns in the 12 months following recessions, is actually negative in the 12 months after bear markets.
Another difference is the relative effectiveness of the value factor during and after bear markets. Value’s returns are reduced (but still slightly positive) during recessions, and its outperformance in the 12-months following not quite as strong as the substantial turnaround we see following a bear market.
Critically, we see that factors don’t move in lockstep around these two distinct market and economic events. And in both cases, we see dramatic reversals in leading and lagging factors before, during and after both recessions and bear markets. As we said earlier, trying to time these shifts is difficult, which is why we emphasize the importance of maintaining diversification across multiple factors.
Case Study: Bear Market of 2000-2002
Moving down from the 30,000-foot view, let’s examine the bear market of 2000-2002. Previously, we analyzed the recession of 2001 to show that factor performance during that event did not line up with long-term historical averages. For this reason, we thought it would be interesting to look at a bear market that occurred around the same time.
The recession of 2001 started in March and lasted for 8 months, ending in October of the same year. In contrast, the bear market predated the recession (beginning in September 2000) and ran for 25 months (ending in September 2002). It was the second-longest bear market after the one that coincided with the Great Depression.
Table #2: Bear Market of Sept 2000-Sept 2002 (25 months)
Fama-French Plus Momentum Factors, Average Monthly Returns (%)
The data for the bear market of 2000-2002 offers a good example of the risks of attempting to time a bear market and tactically adjust factor exposure. While value’s positive performance on average during bear markets hasn’t been as strong as the returns for momentum, profitability, and conservative investments, the bear market of 2000-2002 saw value delivering substantial gains. Recall that growth stocks had been dominant in the tech bubble of the late 1990s and the first quarter of 2000. For the 12 months before this particular bear market, value lagged by an average of 1.30% monthly. The collapse of formerly high-flying growth stocks not only helped usher in the bear market and subsequent recession, but also set the stage for historically discounted and beaten down value stocks to recover strongly. Many investors who had abandoned value stocks during the run-up of tech stocks likely missed out on a substantial portion of value’s gains.
Key Takeaways
As noted earlier, we can’t predict whether a modest drop in stocks presages a dramatic slide into bear market territory. Likewise, we never know if a bounce from market lows will lead to a full recovery or is merely a temporary rally. Examining how factors have performed historically around bear markets is instructive, but also shouldn’t be taken as a prescription for portfolio changes. Remember, the factor returns shown in Table #1 are averages across multiple bear markets, and as we saw when examining the bear market of 2000-2002, they don’t hold every time.
For those reasons, investors should avoid making dramatic changes to their portfolios based on where they believe we are in the market cycle—just as we cautioned against making changes around recessions. Remember that factors have worked over long periods. They don’t always deliver positive returns, but when one is lagging others often provide a positive return cushion. What’s more, those lagging factors have rebounded in the past. For example, small size and value underperformed large growth in the run-up to the most recent bear market and continue to lag. But historical data showing that small size and value have recovered strongly after past bear markets gives us confidence that they will again — we just can’t predict when the turn will happen and how robust the recovery will be.
Considering this evidence, we believe building a well-diversified portfolio with exposure to multiple factors and rebalancing to return to those targets when a factor or asset class moves out of line with your chosen allocation target. That strategy may help investors avoid the costs associated with excessive trading and the substantial risk of missing out on gains by getting the timing wrong as the markets move through their inevitable cycle of bulls and bears.
1 As in our analysis of recessions and factor returns, we have not included the current recession or the 2020 bear market because we have not completed a full market cycle.
DISCLAIMER
The opinions expressed here are exclusively those of Bridgeway Capital Management (“Bridgeway”). Information provided herein is educational in nature and for informational purposes only and should not be considered investment, legal, or tax advice.
Mkt-RF or the equity risk premium is the expected excess return of the market portfolio beyond the risk-free rate. SMB or the size premium measures the additional return investors have historically received by investing in stocks of companies with relatively small market capitalization. HML or the value premium measures the additional return investors have historically received for investing in companies with high book-to-market values. MOM or the momentum premium measures the additional return investors have historically received for investing in companies with positive acceleration in stock price. RMW or the profitability measure is the difference between the returns of firms with robust (high) and weak (low) operating profitability. CMA or the investment factor is the difference between the returns of firms that invest conservatively and firms that invest aggressively.
Past performance is not indicative of future results. Diversification neither assures a profit nor guarantees against loss in a declining market.
Stress Test: How Factors Perform Before, During, and After Recessions
Examining factor returns from past recessions reinforces the importance of diversification and the dangers of market timing
It’s official. On June 8, 2020, the National Bureau of Economic Research (NBER) declared that the United States entered a recession in February of this year. Somewhat anomalously, on that same day the S&P 500 gained 1.21% to move back into positive territory for 2020. After falling roughly 33% from its high to usher in a bear market, the index rallied nearly 45% from its lows on March 23 through the date of NBER’s recession announcement.
So, while it is bad times for the economy, the stock market is regaining its former euphoria. It’s understandable if investors are wondering what this means for stocks going forward, and for the factors that shape their returns. While we can’t predict the future, we can examine how these factors have performed during past recessions—and what happened before and after those events.
Bridgeway’s research into past recessions uncovered data that reminds investors that it’s risky to try to time both the economic cycle and market’s performance. Individual factors don’t move in lockstep during recessions. Some, like momentum, hold up fairly well. Others, like small size and value, lag. However, our research on past recessions also shows that factor performance can turn around quickly, with small size and value enjoying strong returns in post-recessionary periods. We believe this encouraging evidence reinforces the importance of diversifying portfolios across factors and staying the course.
A Historical Look at Factor Returns and Recessions
What are Factors?
Factors are the specific characteristics of stocks and other securities that both drive their returns and explain their performance across different market conditions and business cycles.
Over the very long run, stocks and the economy are related. A better economy means better earnings and valuations for stocks. But the stock market is forward-looking. Investors don’t just wait for official confirmation of economic or company news, but rather act on what they expect to happen. How does this gap between economic performance and investor expectations play out in historic stock returns?
Chart 1 shows the average monthly returns for the Fama-French factors and momentum in a variety of economic environments. The data goes back to July 1926 and includes 15 recessions. The current recession is excluded as it has yet to run its full course.
15 past recessions going back to 1926
Fama-French Plus Momentum Factors, Average Monthly Returns (%)
Market premium (Mkt-RF)
Small size (SMB)
Value (HML)
Momentum (MOM)
Profitability (RMW)
Conservative investments (CMA)
All Months
0.67
0.19
0.35
0.66
0.26
0.27
Expansions
1.02
0.29
0.39
0.67
0.24
0.19
Recessions
-1.00
-0.23
0.18
0.57
0.40
0.86
12M Pre Recession
0.34
-0.22
0.62
0.98
0.71
0.53
12M After Recession
1.95
0.98
0.65
0.54
0.59
0.39
*Average returns through January 2020. Mkt-RF, SMB, and HML data starts in July 1926. Momentum data starts in January 1927, and profitability and investment factors data start in July 1963 Source: Ken French Data Library http://mba.tuck.dartmouth.edu/pages/faculty/ken.french/data_library.html
As we see in the chart’s top row, all factors have positive returns when invested over the long term. Performance differences first appear when we look at the next two rows, which assign these months into two categories: expansions and recessions1. During expansions, all factors are again nicely positive, and are statistically and economically significant. The story is somewhat different when we look at recessions: Both the market’s excess return and small size returns are now negative, and value returns are notably reduced.
These results are not surprising, given that the original Fama-French three factors, which built on the work of others, are often called “risk premiums.” While some have argued that these excess returns are due to behavioral considerations, there is ample evidence for both sides2. During the tough times of a recession are exactly when risk shows up. Investors flee from risky stocks—especially the riskiest beaten down names. Conversely, investors seek out quality companies with good financial health. This helps explain the better returns of the profitability and conservative investment factors, which are stronger than typical during recessions.
Given that we have entered a recession, should investors cut their equity allocation? Or should they move exclusively to larger stocks with good company financial health? The answer is no, not necessarily, because those moves present their own risks.
First, the results above are true on average, but do not happen every single time. Second, factor results depend not just on whether there is a recession, but also on the specific economic and market environment of each instance. What occurs before and after a recession matters, and timing can be crucial.
Timing Matters
Factor behavior can change dramatically during the run up to a recession and in the subsequent recovery. Unfortunately, we can’t know exactly when recessions will begin or end. Those dates are determined by NBER, often well after the fact and subject to subsequent revision.
We see evidence of these shifts in market behavior in the two rows of Chart 1 that give factor returns before and after recessions. There is no standard way to define these periods, so for consistency and convenience we have arbitrarily chosen 12 months3. Periods before a recession are often marked by euphoria: The Roaring 20’s, the tech bubble of the 1990’s, and the period before the recent Great Financial Crisis are well-known examples. Such an environment is particularly reflected in the strong returns for momentum, as stocks that have done well continue their positive run.
Periods following recessions are often filled with cautious optimism about an improving future and increased risk appetite. This is when the stock market—particularly small and value segments—typically put in their strongest performance, reversing their recession blues. Trying to time the market and factor performance runs the risk of missing out on these very substantial gains. It’s not just when you get out, but also when you get back in that matters.
One recent example is that when the impact of COVID-19 became clear, the market sold off rapidly. It then rebounded in anticipation that the unprecedented monetary and fiscal stimulus will moderate the economic damage. Investors who abandoned stocks in anticipation of a recession may well have captured the downside but missed the subsequent rally we have experienced.
Case Study: Recession of 2001
Diving deeper into our data, the recession of 2001 is an interesting example of the risks of attempting to time recessions and adjust factor exposure. We chose to highlight this period because the strong returns for small and value stocks in the 2001 recession is a cautionary tale for those tempted to take refuge in large growth stocks now. The chart below shows the same factors as before, but isolates the months before, during and after this event only.
Recession of 2001 (March – October, 8 months)
Fama-French Plus Momentum Factors, Average Monthly Returns (%)
While small size (SMB) and value (HML) have typically been negative or weak during a recession, both factors had strong returns in the recession of 2001. Large cap and growth stocks had dominated in the tech bubble that grew during the last two years of the 1990s and the first quarter of 2000. Their collapse not only helped usher in the subsequent recession, but also set the stage for historically cheap and beaten down small and value stocks to recover strongly. This outperformance continued after the recession ended. It’s also interesting to note that in the case of value, this reversal actually began before the official start of the recession, which would have provided an important cushion for portfolios that had maintained exposure to value during the tech bubble. That certainly did not happen for value investors before the current recession, but we still believe there is strong evidence that value’s performance will turn around in the future.
Key Takeaways
If timing recessions is hard and picking which factors would do well even harder still, what can investors do? We at Bridgeway go back to the importance of diversification. It is a crucial concept for all investors, and for Bridgeway it includes not just the way we invest but also how we run our firm and the people we hire. Bridgeway focuses on the three broad investment themes of value, company financial health, and momentum. Those stocks with the strongest factor exposures are often smaller, typically giving our portfolios a tilt to smaller size as well. As seen in the top row of Chart 1, all of these factors have worked over time. They usually don’t all work at the same time, and when one is lagging, others often do well.
Bridgeway therefore does not make dramatic changes to our portfolios because we are in a recession, and we think all investors should avoid the temptation. These moves are potentially costly in terms of trading needed to implement those changes and the substantial risks of not getting that timing call exactly right. Instead, we stick with our process and monitor our portfolios to ensure they maintain their targeted allocations to diversifying exposures. The run up to the current recession saw smaller and deeper value stocks lag by historic amounts. If history is a guide, we expect the fortunes of these factors to reverse as the current market cycle runs its course. We don’t know when that turning point will come, but when it does, we believe that investors who’ve maintained a diversified portfolio with broad factor exposure will be rewarded for their discipline.
1 Recessions are defined by NBER. About 18% of the full period months and 12% of the months since July 1963 are in recessions. The remaining months are not in recessions.
2 For a broader discussion of this issue and factor investing generally, see the book “Your Complete Guide to Factor-Based Investing” by Andrew L. Berkin and Larry E. Swedroe.
3 In two instances recessions were less than 24 months apart, so some months were within 12 months of both the prior and next recessions. To give each month a unique classification, we simply divided the intervening time period in half. The before and after recession periods in those cases had less than 12 months.
DISCLAIMER
The opinions expressed here are exclusively those of Bridgeway Capital Management (“Bridgeway”). Information provided herein is educational in nature and for informational purposes only and should not be considered investment, legal, or tax advice.
Mkt-RF or the equity risk premium is the expected excess return of the market portfolio beyond the risk-free rate. SMB or the size premium measures the additional return investors have historically received by investing in stocks of companies with relatively small market capitalization. HML or the value premium measures the additional return investors have historically received for investing in companies with high book-to-market values. MOM or the momentum premium measures the additional return investors have historically received for investing in companies with positive acceleration in stock price. RMW or the profitability measure is the difference between the returns of firms with robust (high) and weak (low) operating profitability. CMA or the investment factor is the difference between the returns of firms that invest conservatively and firms that invest aggressively.
Diversification neither assures a profit nor guarantees against loss in a declining market.